Pricing Strategy Schedule Diagram – Effective Business Management
RM0100006_28
- Last Update 01/26/2025
- File Size 0.3MB
- # of Slides 2
- File Format PPTX
- Slide Ratio 16:9
- Color
Keywords
- #Content-Based Slides
- #Design-Based Slides
- #Business Management
- #Marketing Plan and Strategy
- #Diagram
- #Implementation Plan
- #Pricing Strategy
- #Flow
- #Linear Flow
- #16:9
- #circular diagram PowerPoint
- #pricing strategy slide template
- #4-stage process flow diagram
- #cycle diagram PowerPoint slide
- #business management presentation template
About the Product
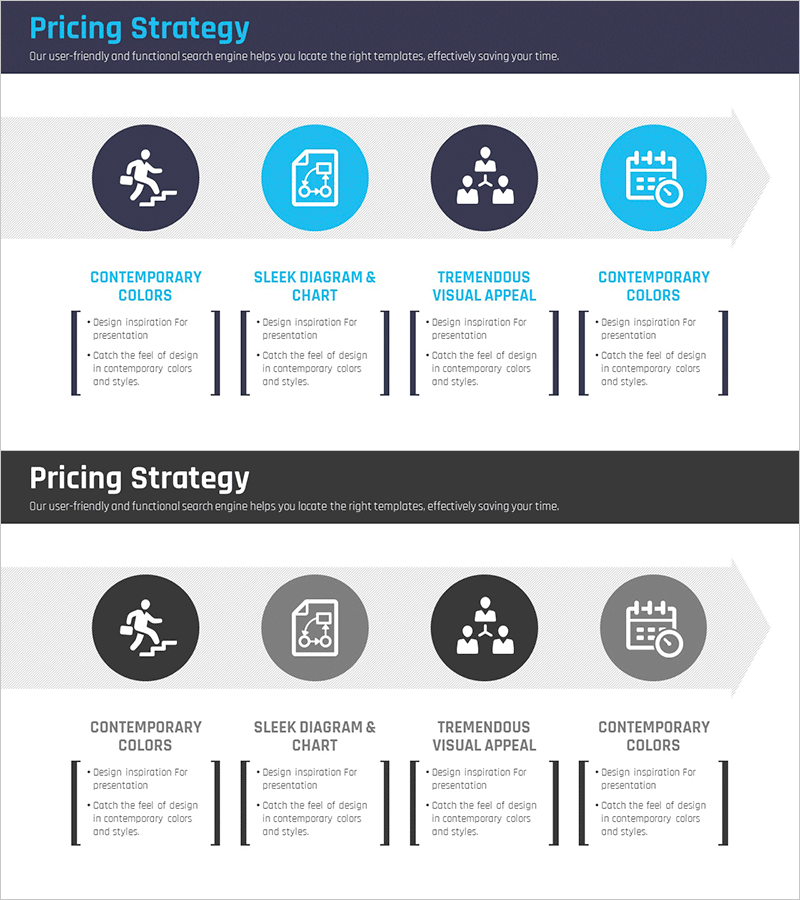
A PowerPoint slide that visualizes the pricing strategy development and execution cycle in a 4-stage circular flow. Features alternating dark navy and bright cyan circular icons connected by directional arrows, with text description areas beneath each stage. Ideal for marketing strategy presentations, business management reports, and strategic planning sessions to communicate continuous improvement cycles. Delivered in 16:9 widescreen format with 2 slides ready for immediate editing and customization.
Usage Points
-
Main Usage
Clearly illustrates the continuous cycle of price policy development, implementation, evaluation, and refinement. Enables audiences to understand pricing logic and ongoing improvement processes in marketing and business strategy presentations.
-
How to Use
Enter specific activities (market research, pricing, sales, performance analysis) in the text areas next to each stage icon. The arrow direction emphasizes the cyclical flow, while color contrast distinguishes each stage clearly.
-
Recommended For
Marketing professionals, executives, and strategic planning teams presenting pricing policies, business plans, and strategy workshops. Effective for explaining product pricing processes and revenue optimization strategies.
-
Slide Structure
2-slide set. First slide features dark navy background with 4 cyan circular icons arranged clockwise and connected by arrows. Second slide repeats the same structure in gray tones as an alternative design option. Text label areas positioned below each icon for customization.
Related Products
-

Nature Theme Future Strategy Linear Diagram
#Business Strategy #Business Management #Diagram
-

Export Business Step-by-Step Schedule Plan – Efficient Business Strategy
#Business Strategy #Business Management #Diagram
-

Design and Execution Process Infographic – Visualize the Workflow
#Business Management #Operational Plan #Diagram
-

Phase-Based Execution Flow Diagram – Visualizing Business Strategy
#Business Strategy #Business Management #Diagram
