Problem-Cause-Solution PowerPoint Slide – Analysis Framework
RBTK0300001
- Last Update 04/29/2026
- File Size 12.6MB
- # of Slides 2
- File Format PPTX
- Slide Ratio 16:9
- Color
Keywords
- #Content-Based Slides
- #Design-Based Slides
- #Operational Plan
- #Diagram
- #Mitigation Measures
- #Table
- #Standard Table
- #16:9
- #problem-cause-solution PowerPoint slide
- #business diagnosis analysis presentation slide
- #root cause analysis PowerPoint template
- #problem solution matrix presentation
- #data-driven diagnosis slide PPT
About the Product
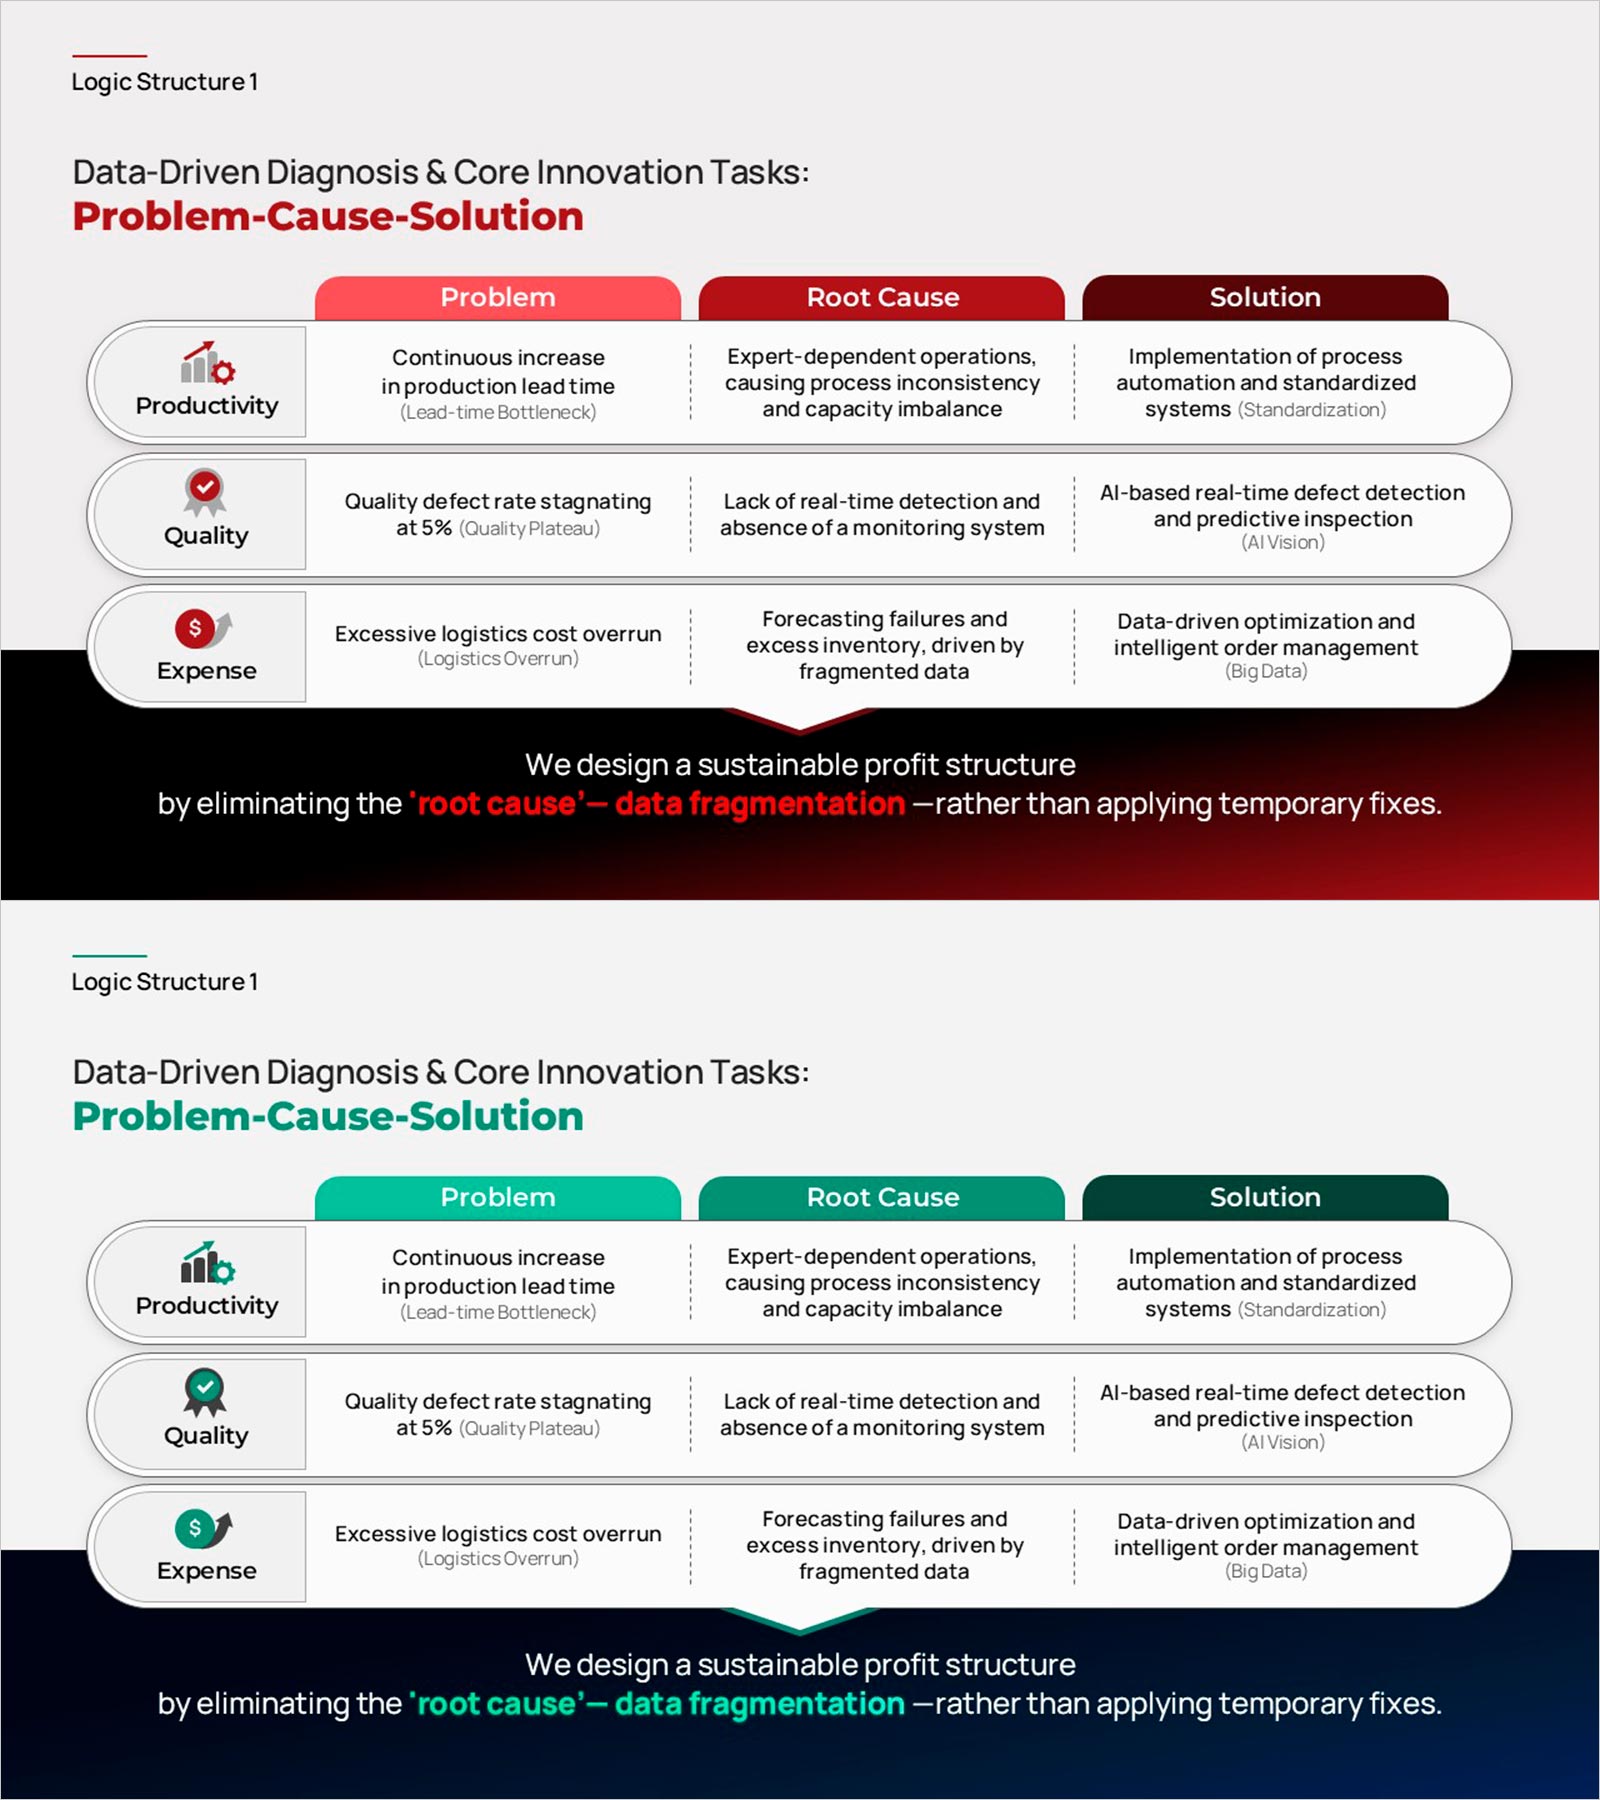
Problem-cause-solution PowerPoint slide template designed for data-driven business diagnosis and analysis. This PPT slide uses a 3×3 matrix to present productivity, quality, and expense across problem, root cause, and solution. It includes use cases such as process automation, AI vision inspection, and big data optimization. A dark footer highlights key insights for clear storytelling. Available in red and green color versions. Fully editable and ideal for consulting reports, strategy presentations, and business plan slide decks.
Usage Points
-
Main Usage
Use as the business diagnosis section in consulting reports and management presentations. Maps three problem areas to root causes and data-driven solutions on one structured PowerPoint slide.
-
How to Use
Replace the row labels with your own diagnostic areas. Edit the problem, root cause, and solution text per row. Update the dark footer with your core insight message in PowerPoint.
-
Recommended For
Ideal for management consultants, strategy teams, and innovation managers presenting root cause analyses to executives, boards, or investors.
-
Slide Structure
Three rows (productivity, quality, expense) × three columns (problem, root cause, solution). Icon cards on the left, center text grid, dark footer insight section. Red and green versions.
Related Products
-

Infographic Template for Issue Resolution – Practical Guide
#Operational Plan #Technical Approach #Diagram
-

Bio Innovation Solutions – Effective Design for Operational Planning
#Operational Plan #Diagram #Graph
-

Liquor Sales Chart – Market Analysis and Performance Management
#Market and Competitor Analysis #Financial Plans and Performance #Diagram
-

Analysis Table for Ingredients
#Product/Service Introduction #Technical Approach #Diagram
