Brand Influence Analysis Roadmap – A Diagram for Strategic Business Implementation
RM0400010_29
- Last Update 08/30/2025
- File Size 0.7MB
- # of Slides 2
- File Format PPTX
- Slide Ratio 16:9
- Color
Keywords
About the Product
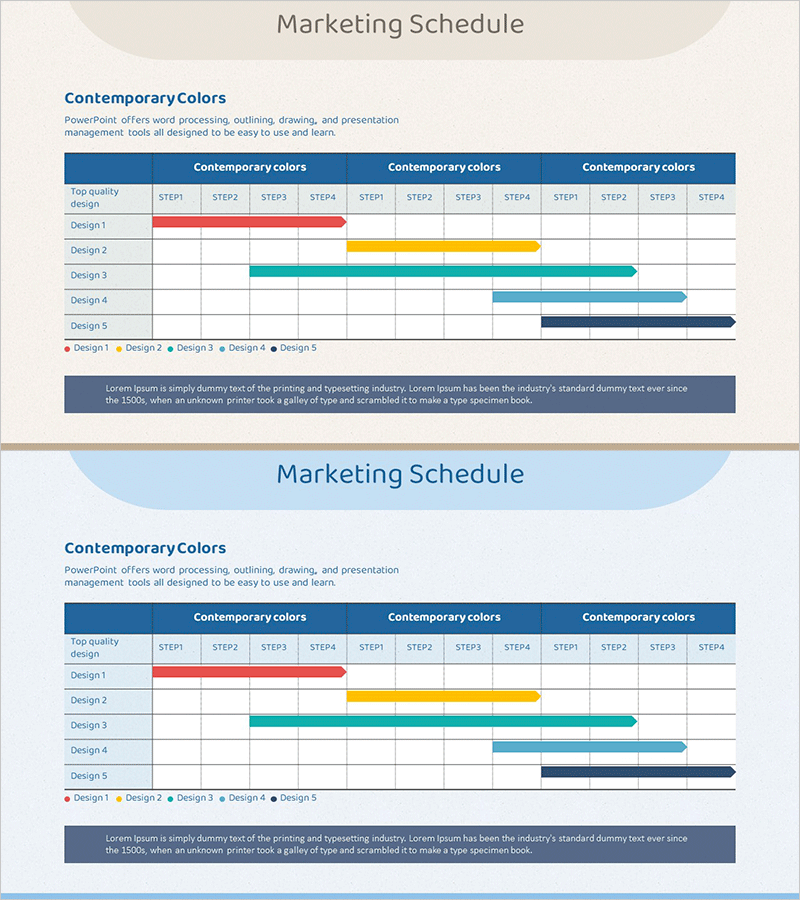
A PowerPoint slide designed to visualize marketing strategy execution timelines and project phases. Features five design options in distinct colors (red, yellow, cyan, light blue, navy) to represent different campaigns or initiatives across STEP1 through STEP4 periods. Optimized for 16:9 widescreen format with 2-slide set for immediate use in marketing plans, business proposals, and strategy presentations. Each colored timeline bar includes dedicated text input areas for phase names, durations, and milestones. The clear layout supports team collaboration, stakeholder alignment, and project tracking across multiple concurrent marketing initiatives.
Usage Points
-
Main Usage
Communicates multi-phase marketing execution plans including product launches, brand campaigns, and market expansion initiatives. Displays phase duration, ownership, and success metrics to align teams on strategic roadmap. Essential for executive presentations, investor pitches, and cross-functional marketing team alignment.
-
How to Use
Each colored timeline (Design 1–5) represents a distinct campaign or project stream. Input actual dates, milestones, and KPIs into STEP1–STEP4 segments and define each design's meaning in the legend. Insert into marketing strategy sections of business plans, quarterly execution roadmaps, and campaign kickoff presentations.
-
Recommended For
Marketing managers, product teams, business development leads, and executives planning multi-campaign execution. Ideal for simultaneous project tracking, new market entry timelines, brand repositioning schedules, and cross-departmental initiative coordination. Strengthens investor presentations, board reports, and team alignment meetings.
-
Slide Structure
Layout includes title area at top, five horizontal timeline bars in center with color-coded phases (STEP1–STEP4), dedicated text input fields per bar, legend section for design definitions, and descriptive text box at bottom. Each timeline bar spans the full width with clear phase demarcation and milestone markers.
Related Products
-

Effective Business Strategy with Yearly Calendar Schedule
#Business Strategy #Operational Plan #Diagram
-

Calendar Illustration Table – Visualizing Business Strategy
#Business Strategy #Business Management #Diagram
-

Cartoon Theme Roadmap Table – Business Strategy Development
#Business Strategy #Operational Plan #Diagram
-

Schedule Checklist for Business Strategy – Efficient Management
#Business Strategy #Operational Plan #Diagram
