Analysis Table for Securing a Safe Distance Between Cars
RJ0400042_4
- Last Update 08/30/2025
- File Size 0.7MB
- # of Slides 2
- File Format PPTX
- Slide Ratio 16:9
- Color
Keywords
About the Product
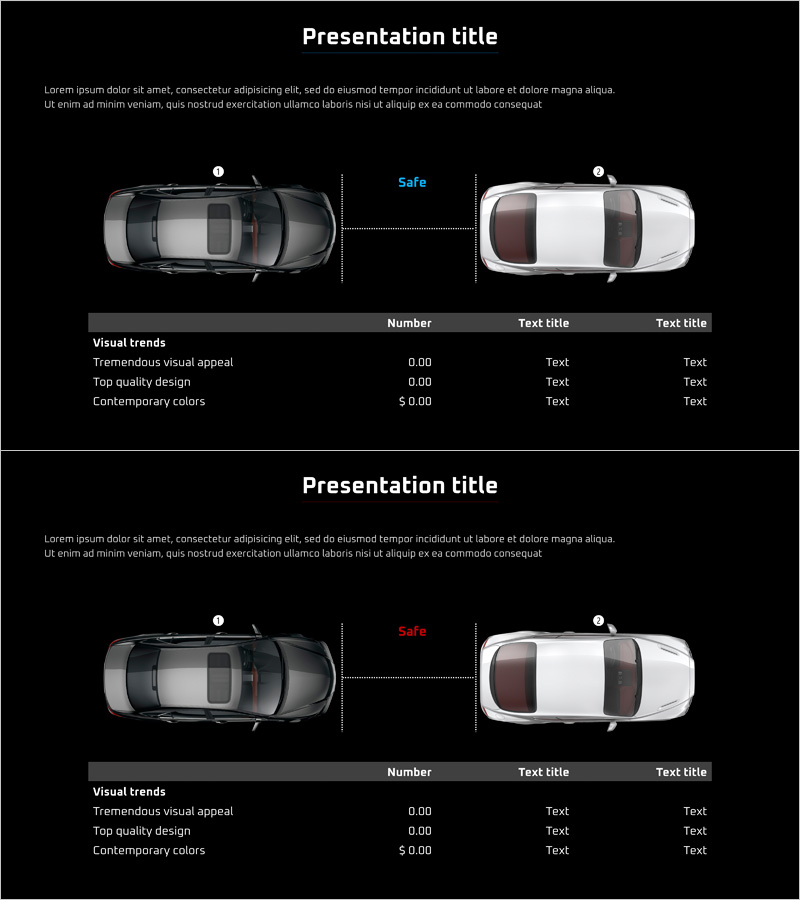
A table-based PowerPoint slide that visually analyzes safe distance between vehicles through a symmetrical comparison structure. Featuring a black background with white and blue typography, the slide displays two vehicle images on the left and right with a central connecting line, and a structured data table below for quantitative information. This design is optimized for presenting safety standards, technical specifications, and performance metrics in automotive presentations, safety training, and engineering documentation. Ready to use immediately for professional technical presentations and educational materials.
Usage Points
-
Main Usage
Quantitatively compare and analyze safe distance standards between vehicles, presenting design specifications and performance metrics at a glance. The symmetrical left-right structure visualizes two scenarios simultaneously, providing clear decision-making evidence.
-
How to Use
Apply in automotive technical presentations, safety training seminars, product development reports, and regulatory compliance documentation. Edit table numbers and text to customize for various comparison scenarios, and replace vehicle images as needed for different applications.
-
Recommended For
Automotive engineers, safety managers, technical marketing teams, training instructors, and policy makers who need to communicate technical standards and performance comparisons persuasively. Particularly effective for regulatory compliance, product differentiation, and safety certification presentations.
-
Slide Structure
Two-slide set. Each slide features a title at the top, symmetrically positioned vehicle images with connecting lines in the center, and a structured data table below (3 rows × 3 columns with Visual trends, Number, and Text title headers). Black background with white typography and blue/red accent text creates clear data hierarchy.
Related Products
-

Competitor Analysis and Competitive Advantage Visualization – Harmony of Green and Orange
#Market and Competitor Analysis #Diagram #Graph
-

Dark AI vs VC Comparison Table Slide – Case Study PowerPoint
#Market and Competitor Analysis #Diagram #Market Status
-

Competitiveness Table and Chart Analysis – Market and Competitor Analysis
#Market and Competitor Analysis #Diagram #Graph
-

Visualizing Market Trends with Musician Comparison Graphs
#Market and Competitor Analysis #Diagram #Graph
