Navy Red Table Slide – Clearly Visualizing Financial Performance
RJ0600056_14
- Last Update 08/28/2025
- File Size 2.1MB
- # of Slides 2
- File Format PPTX
- Slide Ratio 16:9
- Color
Keywords
About the Product
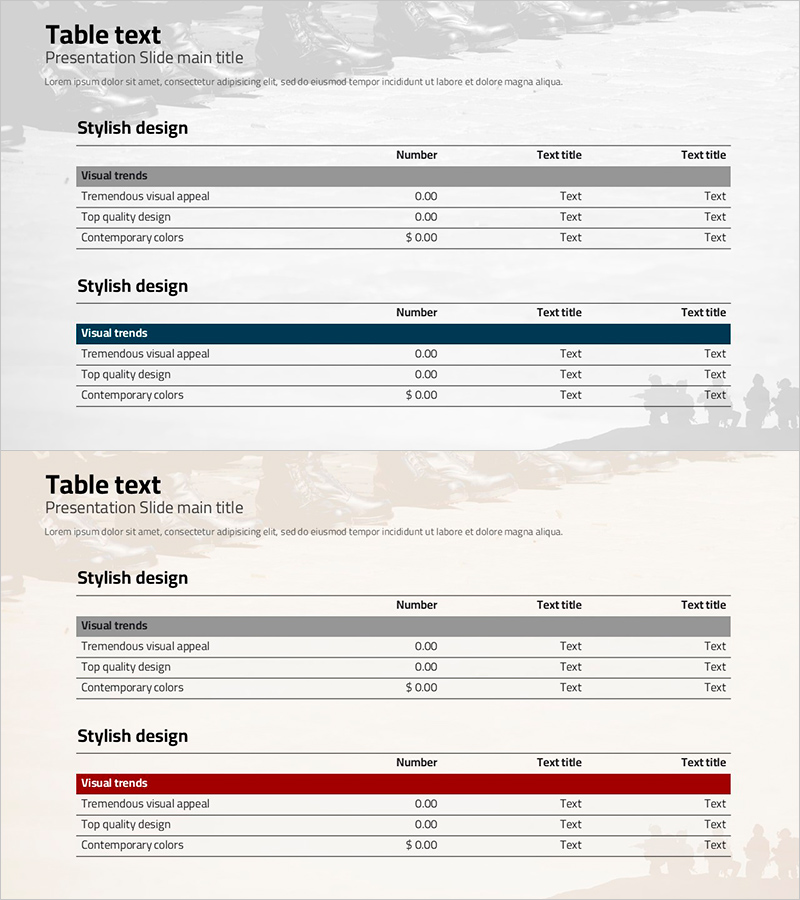
A 2-slide table set that clearly visualizes financial performance and budget status. The design uses navy headers and red accent colors to create strong contrast for presenting numerical data such as income statements, budget forecasts, and financial metrics. Each slide features a 3-column input structure enabling quarter-over-quarter or year-over-year comparative analysis and performance tracking at a glance. Provided in PowerPoint 16:9 widescreen format with fully editable text and numerical fields for immediate use in presentations.
Usage Points
-
Main Usage
Present numerical financial data—revenue, expenses, budget allocations, and key metrics—in a structured table format to investors, employees, and partners. Enables clear quarter-by-quarter or year-over-year comparisons and highlights performance trends at a glance.
-
How to Use
Use in investor relations materials, financial reports, earnings presentations, and executive briefings. Enter line items in the navy header row and corresponding figures in data cells; apply red highlighting to emphasize critical metrics and improve readability.
-
Recommended For
CFOs, finance managers, executives, investor relations teams, and audit professionals presenting financial results. Ideal for quarterly earnings calls, budget review meetings, shareholder presentations, and financial forecasting sessions.
-
Slide Structure
Two-slide set with each slide containing a title area, 3-column header row (navy background), and 3 data input rows. The first slide uses a gray header while the second features a navy header, allowing flexible representation of different financial categories and metrics.
Related Products
-

Marketing Budget Allocation Table – Effective Budget Planning
#Financial Plans and Performance #Diagram #Income Statement
-

Network Development Budget and Profit and Loss Statement – Financial Planning Visualization
#Financial Plans and Performance #Diagram #Income Statement
-

Table Chart Comparison Slide – Visualizing Financial Performance
#Financial Plans and Performance #Diagram #Income Statement
-

Slide Template Presenting Text and Numbers – Communication and Efficiency
#Financial Plans and Performance #Diagram #Income Statement
