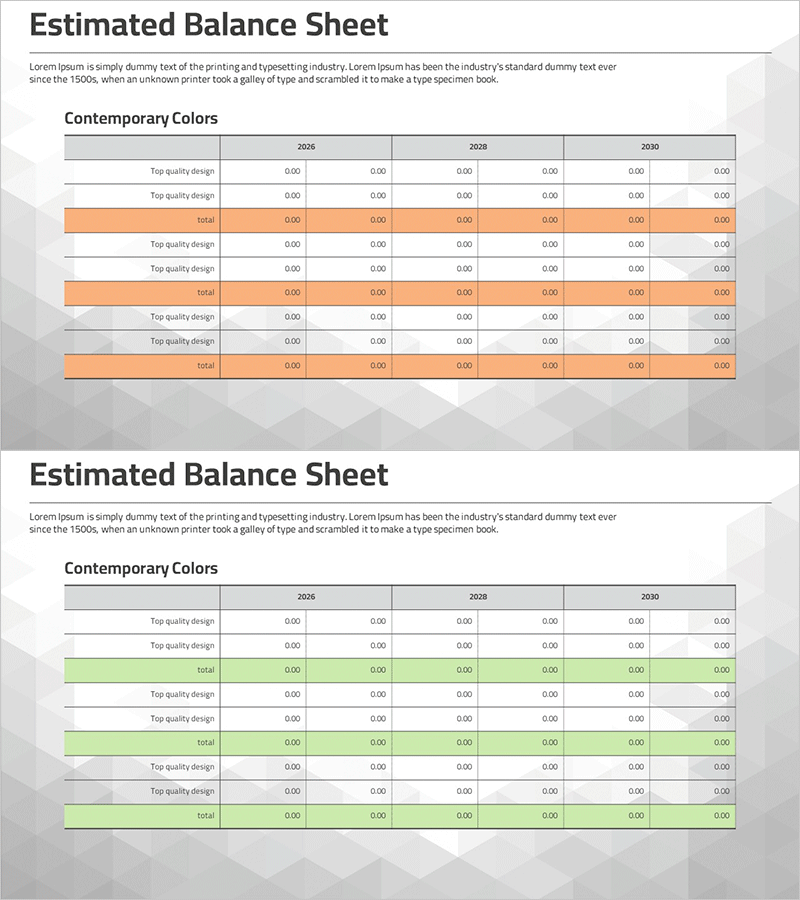
Estimated Balance Sheet Table – Essential for Financial Performance
RM0100002_31
- Last Update 01/24/2025
- File Size 0.4MB
- # of Slides 8
- File Format PPTX
- Slide Ratio 16:9
- Color
Keywords
- #Content-Based Slides
- #Design-Based Slides
- #Financial Plans and Performance
- #Diagram
- #Balance Sheet
- #Income Statement
- #Table
- #Standard Table
- #16:9
- #table PowerPoint slide
- #financial balance sheet presentation
- #horizontal table template
- #financial data visualization
- #balance sheet slide deck
- #financial performance table
About the Product
A comprehensive 8-slide PowerPoint presentation featuring horizontal table layouts designed to visualize financial performance and balance sheet data. This slide deck uses a gray and orange accent color scheme to organize complex financial information into clear, structured rows and columns. Each slide is optimized for presenting estimated balance sheets, financial forecasts, performance metrics, and comparative analysis. The 16:9 widescreen format in PPTX allows full customization of text and numerical data, making it ideal for financial reports, investor presentations, and business planning documents. Cells are fully editable to accommodate various financial statements and reporting requirements.
Usage Points
-
Main Usage
Present financial statements including balance sheets, income statements, and cash flow statements in investor pitches, annual reports, and business plans. The structured table format enables side-by-side comparison of financial metrics across multiple periods, making complex data accessible to stakeholders.
-
How to Use
Enter financial line items and corresponding values into each table cell. Use the gray header row for period labels (years, quarters) and the orange accent row for totals or key performance indicators. Rows and columns can be added, removed, or resized to match your specific financial data structure.
-
Recommended For
CFOs, financial analysts, accountants, investment professionals, and executives presenting financial results. Suitable for banks, insurance companies, investment firms, and corporate finance teams conducting investor relations meetings and shareholder presentations.
-
Slide Structure
8 slides with horizontal table layouts containing 3–6 columns and 4–8 rows per slide. Gray header rows and orange accent rows alternate to enhance data readability. All slides maintain 16:9 aspect ratio for consistent presentation across devices.
Related Products
-

Organizing Insights for Clarity – Emphasizing Financial Planning and Performance
#Financial Plans and Performance #Diagram #Balance Sheet
-

Comparative Analysis Table Chart for Financial Performance – Trust and Expertise
#Financial Plans and Performance #Diagram #Balance Sheet
-

Yellow Green Income Statement Table – Efficient Financial Analysis
#Financial Plans and Performance #Diagram #Balance Sheet
-

Table of Contents for Profit Achievement – Visualizing Financial Plans
#Financial Plans and Performance #Diagram #Balance Sheet
