Green Purple Table Chart – Diverse Data Presentation
RJ0900034_13
- Last Update 08/26/2025
- File Size 2.3MB
- # of Slides 2
- File Format PPTX
- Slide Ratio 16:9
- Color
Keywords
About the Product
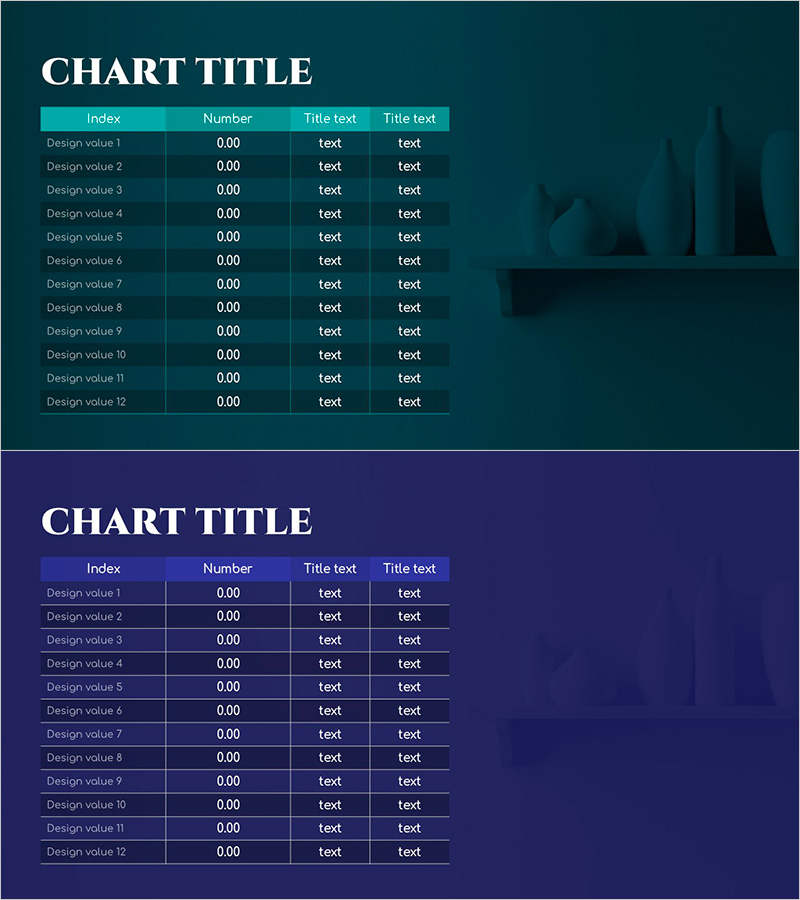
A table diagram PowerPoint slide featuring green and purple dual-tone backgrounds for organizing 12 data items with numerical values and text descriptions. The header row is highlighted in teal, with each data row containing four columns: index, number, title text, and additional text. This 2-slide set offers both green and purple background options in 16:9 widescreen format for clear readability. Ideal for business reports, performance analysis, and data-driven presentations where systematic information comparison is essential.
Usage Points
-
Main Usage
Organize and compare 12 data items across four columns (index, number, title, description) using a structured table layout. The teal header row provides visual hierarchy and clear column identification for presenting numerical and textual information side by side.
-
How to Use
Apply to quarterly business performance reports, marketing channel analysis with KPI metrics, financial presentations showing monthly or departmental data, competitive analysis in proposals, and executive dashboards. Simply edit cell text to input your actual data values and descriptions.
-
Recommended For
Finance and accounting professionals presenting monthly results, marketing teams analyzing channel performance metrics, sales organizations comparing client portfolios, management consultants conducting benchmarking studies, and executives preparing data-driven decision presentations.
-
Slide Structure
2-slide set: green-tone background table + purple-tone background table. Each slide contains a title area and a 4-column × 12-row data table with teal header highlighting. Columns are labeled index, number, title text, and title text for flexible data input.
Related Products
-

Orange Hexagon Diagram Template - Stand Out Your Business Introduction
#Company Introduction #Diagram #Business Areas
-

Typographic Wide Template Flow Diagram – Innovative Business Strategy
#Business Strategy #Technical Approach #Diagram
-

Market Analysis Slide Using Donut Charts and Table
#Market and Competitor Analysis #Diagram #Graph
-

Car Wide Template Table – Visualizing Financial Performance
#Financial Plans and Performance #Diagram #Sales and Revenue
