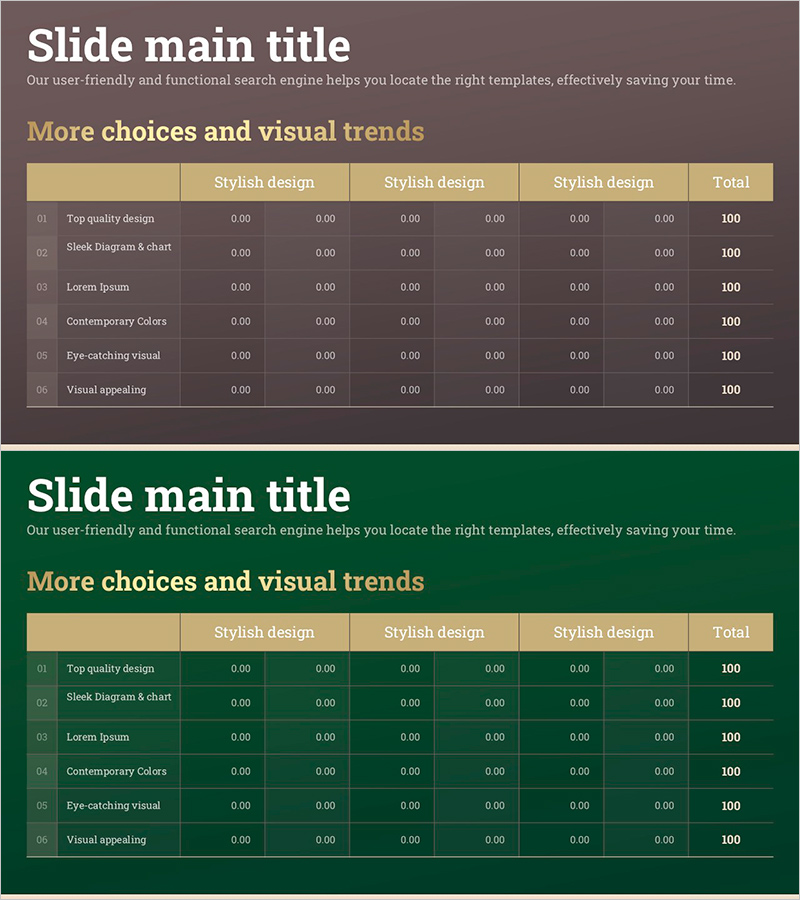
Gold Table Design Diagram – Stylish Visual
RJ0900023_8
- Last Update 08/23/2025
- File Size 0.3MB
- # of Slides 2
- File Format PPTX
- Slide Ratio 16:9
- Color
Keywords
About the Product
A 6-column table diagram PowerPoint slide designed for comparing and organizing data across multiple categories. The gold header row and green-brown background create a professional visual hierarchy, with editable cells for text and numerical data. This 2-slide set includes layout variations of the same design, making it ideal for comparison sections in reports, proposals, and business plans. Delivered in 16:9 widescreen PPTX format, fully compatible with all PowerPoint versions for seamless editing.
Usage Points
-
Main Usage
Presents multiple items, features, pricing tiers, or performance metrics in a clear side-by-side comparison format. Ideal for product comparisons, service options, team responsibilities, budget breakdowns, and any presentation requiring structured data visualization.
-
How to Use
Enter category names in the gold header row and corresponding data in the cells below. The gold header emphasizes key information while the green and brown backgrounds distinguish rows for easy reading. Use both slides consecutively for extended comparisons or select individual layouts as needed.
-
Recommended For
Executive reports, business proposals, strategic plans, marketing presentations, product comparison pitches, financial analysis, organizational charts, project timelines, and any role requiring clear data comparison and structured information presentation.
-
Slide Structure
6-column table format with gold header row for category names and 5 data rows below. Green and brown background alternation provides row distinction. The 2-slide set offers layout variations of the same design for extended comparison displays and flexible presentation options.
Related Products
-

Stock Structure and Issuance History Analysis Table – Integrated Financial Data
#Financial Plans and Performance #Diagram #Capital Requirements
-

F&B Menu PowerPoint Slide – Circular 4-Step Process Layout
#Operational Plan #Diagram #Business Processes
-

Mobile Service Characteristics Triangle Diagram – Features and Composition
#Product/Service Introduction #Diagram #Features
-

Visualizing Scientific Networks with a Diffusion Diagram
#Business Introduction #Technical Approach #Diagram
