Forward-Looking Radar Chart – Enhancing Market Analysis and Competitive Edge
RJ0900020_20
- Last Update 08/21/2025
- File Size 6.2MB
- # of Slides 2
- File Format PPTX
- Slide Ratio 16:9
- Color
Keywords
- #Content-Based Slides
- #Design-Based Slides
- #Product/Service Introduction
- #Market and Competitor Analysis
- #Diagram
- #Graph
- #Differentiation Strategy for Products/Services
- #Future Outlook
- #Flow
- #Other
- #Radar Chart Spider Chart
- #16:9
- #radial chart PowerPoint
- #radar chart slide template
- #5-axis diagram presentation
- #market analysis PowerPoint
- #competitive assessment chart
About the Product
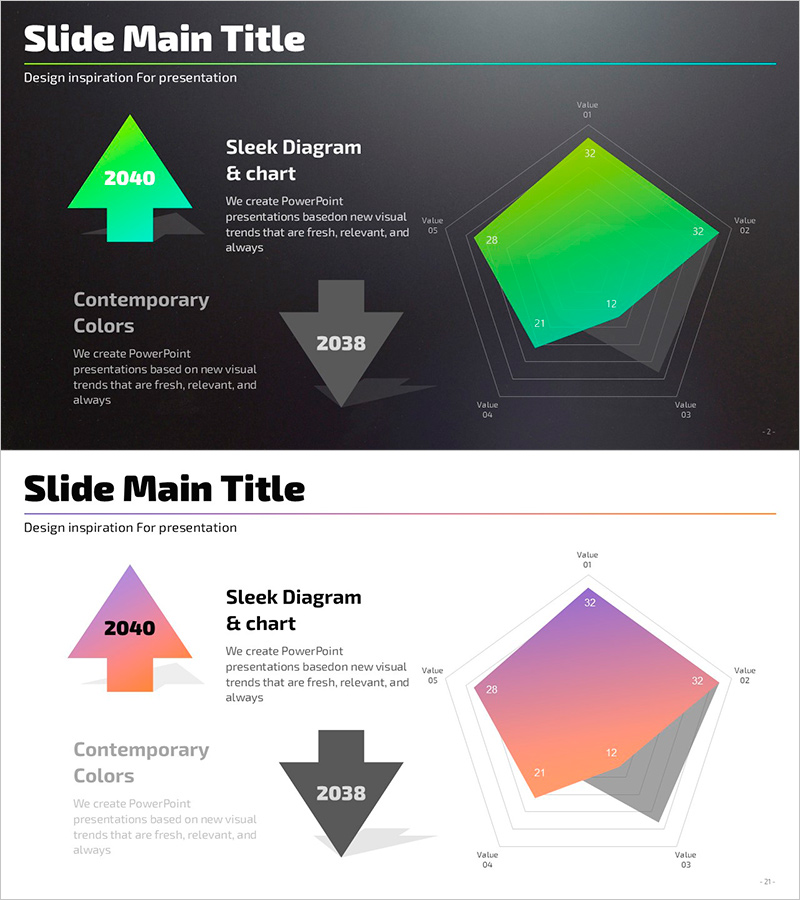
A 5-axis radial chart (radar chart) PowerPoint slide set designed for multi-dimensional data comparison. Features lime-green and pink gradient color schemes to visualize data series, ideal for market analysis, product competitiveness evaluation, and capability assessment. The 2-slide set is ready to use immediately in various presentation scenarios.
Usage Points
-
Main Usage
A radial chart comparing multiple metrics simultaneously, used for product competitiveness, market positioning, capability assessment, and performance analysis. Input numerical values on each of the 5 axes to automatically visualize data areas, revealing strengths and weaknesses at a glance.
-
How to Use
Slide 1 uses lime-green series; Slide 2 uses pink-orange-gray gradient to compare two data sets. Edit axis labels and values to compare products, competitors, or departmental performance, or use as market analysis material in presentations.
-
Recommended For
Suitable for product introductions, marketing plans, business reports, investor pitch decks, strategic management presentations, and market research analysis. Effective for sales, marketing, strategy planning, and executive-level presentations requiring complex data visualization.
-
Slide Structure
Two 5-axis radial chart variations. Slide 1 displays a single lime-green series; Slide 2 overlays three series (pink, orange, gray) for comparison. Each axis labeled Value 01–05. 16:9 widescreen PPTX format with editable data fields.
Related Products
-

Camping Isometric Production and Technology Development Strategy – Innovative Approach
#Product/Service Introduction #Diagram #Product/Service Introduction
-

Farming Harvest Business Direction Arrow – Effective Path Setting
#Product/Service Introduction #Business Strategy #Diagram
-

3D Printing Product Sales Differentiation Strategy Slide
#Product/Service Introduction #Business Vision and Strategy #Diagram
-

Flower and Strategy Diagram – Visualizing Business Vision
#Product/Service Introduction #Business Vision and Strategy #Diagram
