Design and Execution Process Infographic – Visualize the Workflow
RJ0900019_9
- Last Update 08/21/2025
- File Size 0.6MB
- # of Slides 2
- File Format PPTX
- Slide Ratio 16:9
- Color
Keywords
- #Content-Based Slides
- #Design-Based Slides
- #Business Management
- #Operational Plan
- #Diagram
- #Implementation Plan
- #Business Processes
- #Flow
- #Linear Flow
- #16:9
- #linear diagram PowerPoint
- #3-step process slide
- #workflow diagram template
- #business process PPT slide
- #how to create process diagram in PowerPoint
- #arrow flow chart
About the Product
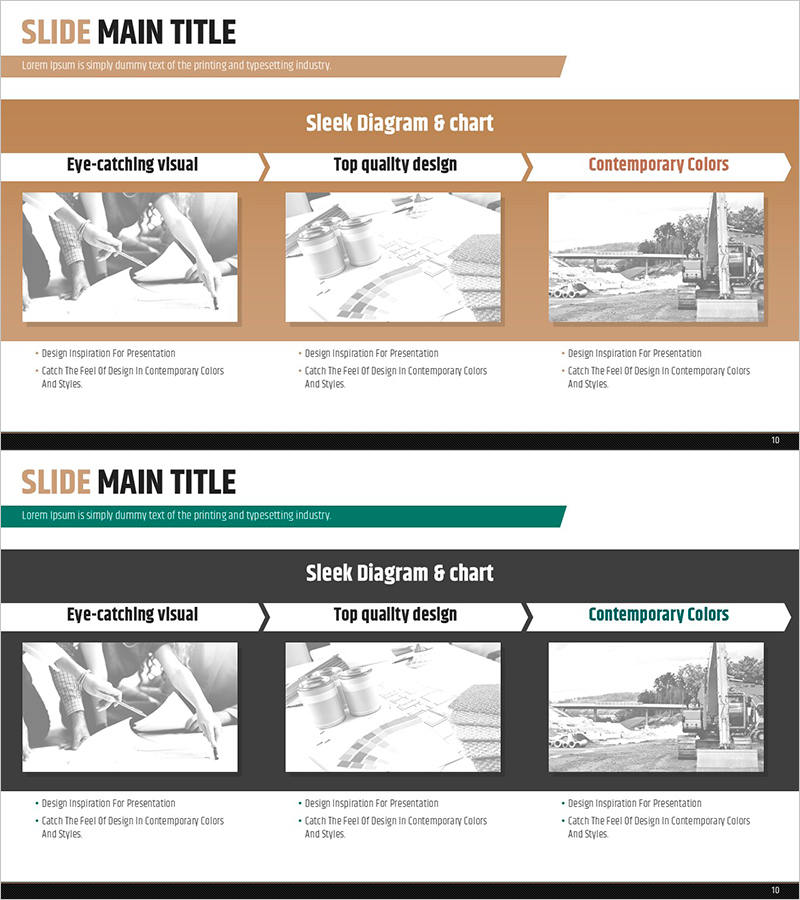
A PowerPoint slide template that visualizes design and execution processes through a 3-step linear flow diagram. The beige, gray, and teal arrow-connected structure clearly illustrates workflow stages, with dedicated image areas and text descriptions for each step. This PPT diagram slide is ready to use for business management, operational planning, and project progress presentations. The 2-slide set allows flexible representation of various process flows and sequential workflows.
Usage Points
-
Main Usage
Clearly presents sequential processes from design through execution phases. Organizes department responsibilities, roles, and timelines for each stage to improve team comprehension. Optimized for strategy sections in business plans, operational plans, and project proposals.
-
How to Use
Enter project names, responsible parties, and timelines in each stage box. Insert related photos or icons in the image areas. Adjust arrow colors and text sizes to emphasize critical stages. Use the 2 slides sequentially or modify into parallel comparison structures based on presentation flow.
-
Recommended For
Project managers, business planning teams, operations managers, and consultants explaining process improvements, new business initiatives, and organizational restructuring. Effective for internal reports and client proposals in manufacturing, construction, IT, and finance industries where step-by-step processes are essential.
-
Slide Structure
Three nodes (Design, Execution, Completion) connected left-to-right with arrow connectors in linear arrangement. Each node includes a horizontal image insertion area and separate text description space. Beige background with gray and teal accent lines and arrows marking stage transitions.
Related Products
-

Systematic Schedule Management – Efficient Action Plan
#Business Management #Diagram #Implementation Plan
-

Dark 4-Step Investment Process PowerPoint – Timeline Cards
#Business Strategy #Business Management #Operational Plan
-

Technology Service Promotion Plan and Process – Linear Flow Diagram
#Business Management #Operational Plan #Diagram
-

Food Truck Sales Strategy – The First Step to Successful Business Operations
#Business Management #Operational Plan #Diagram
