Sports Infographic Strategy Diagram – Vision and Competitiveness
RJ0600016_15
- Last Update 06/24/2025
- File Size 0.7MB
- # of Slides 2
- File Format PPTX
- Slide Ratio 16:9
- Color
Keywords
- #Content-Based Slides
- #Design-Based Slides
- #Business Introduction
- #Business Vision and Strategy
- #Diagram
- #Technological Status
- #Business Strategy
- #Cluster
- #Spread
- #Chain Diagram
- #Centralized Diagram
- #16:9
- #radial center diagram PowerPoint
- #sports strategy presentation slide
- #3-element divergence diagram
- #vision competitiveness PPT
- #radial structure slide template
About the Product
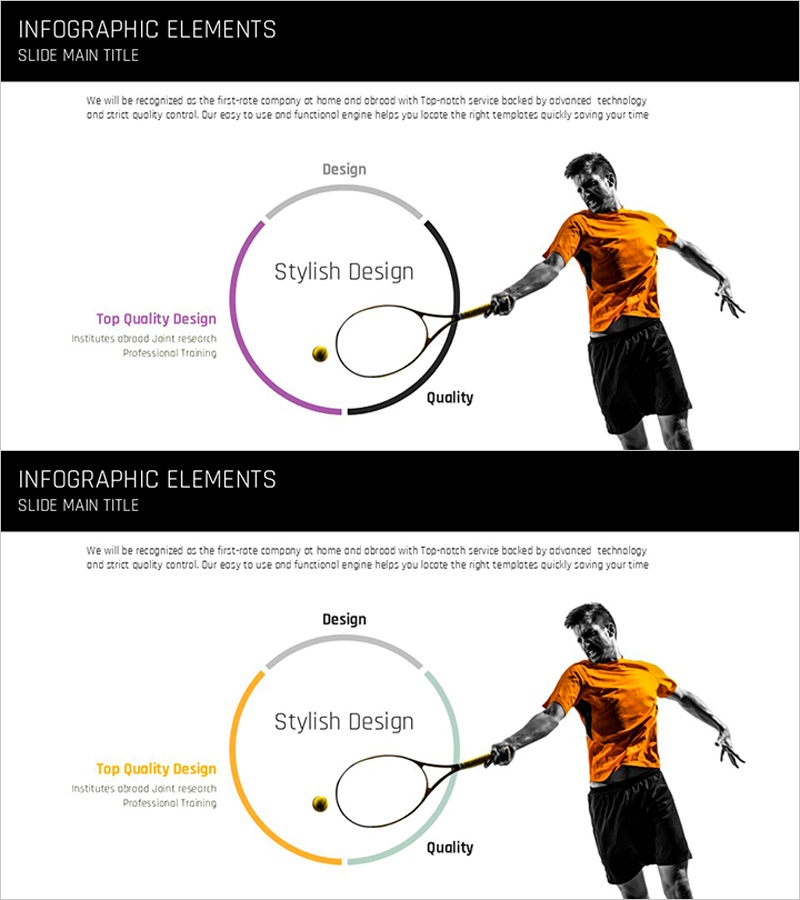
A radial center diagram PowerPoint slide optimized for sports industry strategy presentations. This slide features a central concept (Stylish Design) that radiates outward to three key elements—Design, Quality, and supporting factors—creating a dynamic visual hierarchy. The design combines an orange accent image with purple and black arc lines, delivering a compelling presentation style. Ideal for sports marketing, brand strategy, and organizational capability presentations. The 2-slide set includes color variations (purple and orange tones) allowing you to select the version that best matches your presentation context.
Usage Points
-
Main Usage
Visualizes organizational core strategy by radiating from center to periphery, enabling stakeholders to grasp multi-layered elements such as vision, competitiveness, and execution strategy at a glance. Highly effective for sports industry, marketing, and organizational development presentations where strategic relationships must be clearly communicated.
-
How to Use
Enter your core concept (e.g., brand, vision, strategy) in the central circle, then populate the three surrounding arc sections with supporting elements (Design, Quality, etc.). Leverage the color-variant slide to match your presentation tone, and edit text labels to align with your organization or industry context.
-
Recommended For
Recommended for marketing professionals, strategic planners, and executives presenting sports marketing, brand strategy, and organizational capability initiatives. Particularly suited for C-suite briefings, investor pitches, and organizational development seminars where the relationship between core values and supporting elements must be emphasized.
-
Slide Structure
2-slide set featuring identical radial center structure in purple and orange color schemes. One central node radiates to three arc sections (Design, Quality, and additional factors), with a dynamic sports athlete image positioned on the right to enhance visual impact and engagement.
Related Products
-

Key Chemical Composition Charts for Effective Data Visualization
#Business Introduction #Diagram #Business Areas
-

Strategic System for Victory – Creativity and Vision
#Business Vision and Strategy #Technical Approach #Diagram
-

Construction Business Strategy Framework – Growth and Innovation
#Business Vision and Strategy #Technical Approach #Diagram
-

5 Diagrams of Eco-friendly Business Strategies
#Business Vision and Strategy #Diagram #Business Strategy
