Task Propulsion Schedule Diagram - Visualization of Business Plans and Strategies
RJ0900015_12
- Last Update 08/20/2025
- File Size 0.5MB
- # of Slides 2
- File Format PPTX
- Slide Ratio 16:9
- Color
Keywords
- #Content-Based Slides
- #Design-Based Slides
- #Business Strategy
- #Business Management
- #Diagram
- #Roadmap
- #Implementation Schedule
- #Cluster
- #Chain Diagram
- #16:9
- #timeline diagram PowerPoint
- #task schedule slide
- #milestone presentation template
- #project timeline diagram
- #connection diagram slide
- #business strategy roadmap
- #how to create timeline in PowerPoint
About the Product
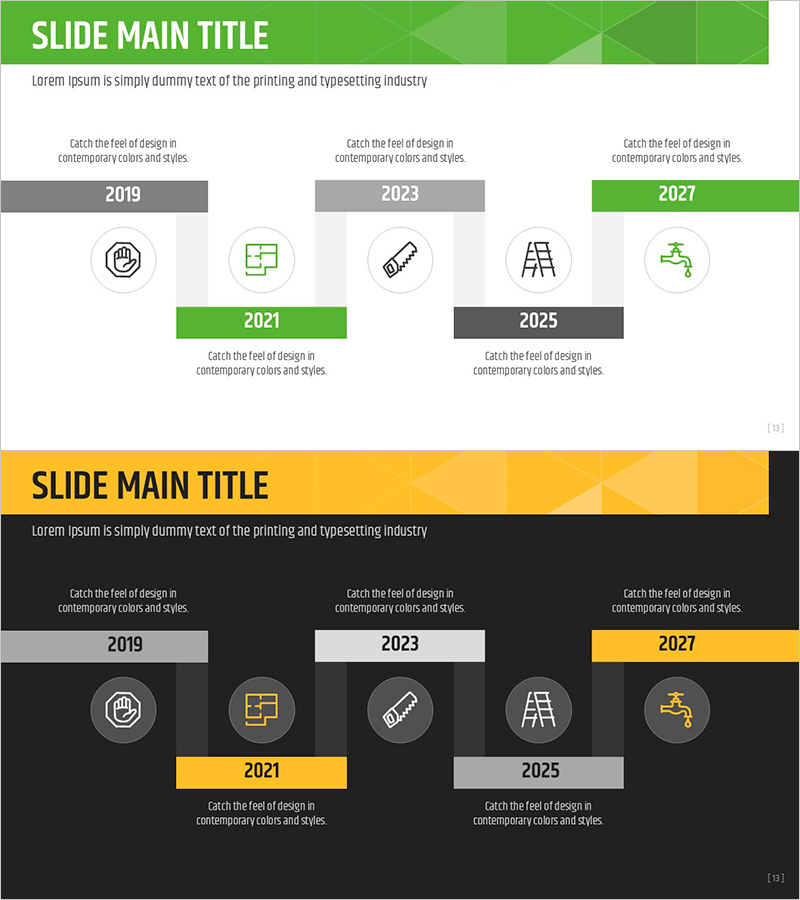
A timeline connection diagram PowerPoint slide that visualizes business strategy and task schedules across five milestone years (2019, 2021, 2023, 2025, 2027). The slide features a horizontal layout with green and gray color accents, icons representing work activities at each stage, and text description areas for detailed information. Designed in 16:9 aspect ratio with 2 slides, this presentation template is ready to use in business plans, strategy presentations, and project management reports. Connection lines and arrows clearly convey temporal flow and cause-effect relationships, enabling stakeholders to understand the complete project timeline at a glance.
Usage Points
-
Main Usage
This diagram is optimized for expressing business schedules and milestones in chronological stages, clearly communicating work content and objectives at each phase through icons and text. It enables stakeholders to comprehend the entire project lifecycle from initiation to completion in a single view.
-
How to Use
Insert this slide into the strategy section of business plans, the timeline planning portion of project proposals, or the milestone status page of executive reports. Customize the year labels, edit text descriptions, and replace icons to match your actual project schedule and organizational needs.
-
Recommended For
Business strategists, project managers, marketing planners, executive report coordinators, and investment professionals. Particularly effective for presenting medium-to-long-term business plans, new product launch timelines, organizational restructuring schedules, and digital transformation roadmaps.
-
Slide Structure
Composed of 2 slides, each featuring 5 milestone nodes (2019, 2021, 2023, 2025, 2027) arranged horizontally in a timeline format. Below each node are text areas for descriptions and icons representing work activities. Connection lines link the nodes to show temporal progression. The first slide uses a green background while the second employs a black background for visual variety.
Related Products
-

Construction Plan Diagram – Clear Visualization of Project Strategy
#Business Strategy #Business Management #Diagram
-

Connected Future Planning – Blueprint for Business Strategy
#Business Strategy #Business Management #Diagram
-

Travel Business Future Development Plan and Outlook Diagram
#Business Strategy #Business Management #Diagram
-

Marketing Effectiveness Analysis Slide – Cluster Diagram for Operational Planning
#Business Management #Operational Plan #Diagram
