Construction Plan Diagram – Clear Visualization of Project Strategy
RJ0900011_6
- Last Update 08/19/2025
- File Size 1.3MB
- # of Slides 2
- File Format PPTX
- Slide Ratio 16:9
- Color
Keywords
- #Content-Based Slides
- #Design-Based Slides
- #Business Strategy
- #Business Management
- #Diagram
- #Roadmap
- #Implementation Schedule
- #Cluster
- #Chain Diagram
- #16:9
- #linear diagram PowerPoint
- #project timeline slide
- #6-stage connection diagram
- #business roadmap PowerPoint template
- #construction plan presentation slide
- #process flow diagram PowerPoint
About the Product
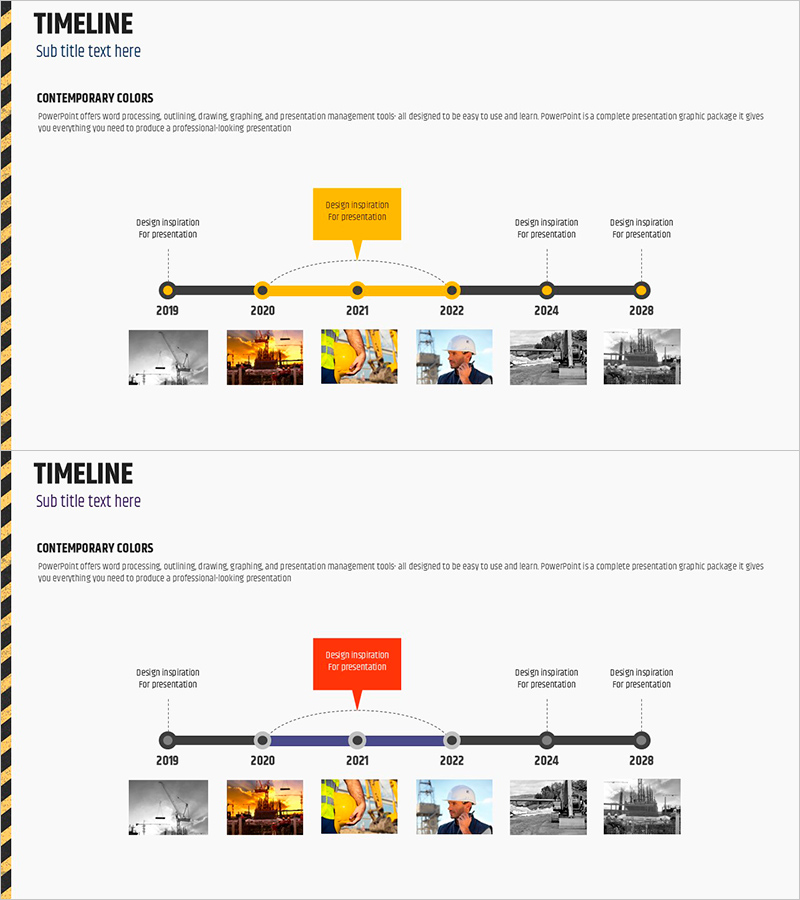
A linear connection diagram PowerPoint slide that visualizes business strategy and project execution phases across six sequential stages. The 2-slide set features black circular nodes connected by a horizontal timeline with golden accent elements highlighting key milestones. Each stage includes text description boxes and image placeholders for supporting visuals. Dotted connectors and directional arrows clarify the process flow. This presentation slide template is ready to use for construction, manufacturing, IT, and strategic planning presentations requiring clear phase-by-phase progress visualization.
Usage Points
-
Main Usage
Visualize project phases, business execution timelines, and strategic roadmaps on a time-based axis to communicate the complete project scope to stakeholders. Emphasize milestones and key activities at each stage for effective project management reporting and progress updates.
-
How to Use
Enter phase names, dates, and responsible parties in each node. Add key activities, objectives, and deliverables in the text boxes for each stage. Insert relevant photos, charts, or graphics in the image areas to reinforce stage-specific details. Adjust node colors and sizes to indicate priority levels.
-
Recommended For
Project managers, strategy teams, and executives in construction, manufacturing, IT, finance, and other industries managing long-term projects. Ideal for project kickoff presentations, investor reports, internal progress updates, and strategic planning meetings.
-
Slide Structure
2-slide layout with title area at top. Central horizontal timeline with 6 black circular nodes connected by a line. Golden accent boxes above each node with text description areas. Image placeholder row at bottom for 6 supporting visuals. Dotted curved connectors and arrows indicate relationships between stages.
Related Products
-

Travel Business Future Development Plan and Outlook Diagram
#Business Strategy #Business Management #Diagram
-

Connected Future Planning – Blueprint for Business Strategy
#Business Strategy #Business Management #Diagram
-

Task Propulsion Schedule Diagram - Visualization of Business Plans and Strategies
#Business Strategy #Business Management #Diagram
-

Yearly Career Advancement Plan – Business Implementation Strategy
#Business Strategy #Business Management #Diagram
