Development Status by Technology Diagram Slide - Core Information
RJ0900011_19
- Last Update 08/19/2025
- File Size 0.5MB
- # of Slides 2
- File Format PPTX
- Slide Ratio 16:9
- Color
Keywords
- #Content-Based Slides
- #Design-Based Slides
- #Product/Service Introduction
- #Business Introduction
- #Diagram
- #Development Status
- #Technological Status
- #Spread
- #Radial Diagram
- #16:9
- #radial diagram PowerPoint
- #centrifugal expansion slide
- #5-node diagram template
- #technology status presentation
- #business domain analysis PPT
About the Product
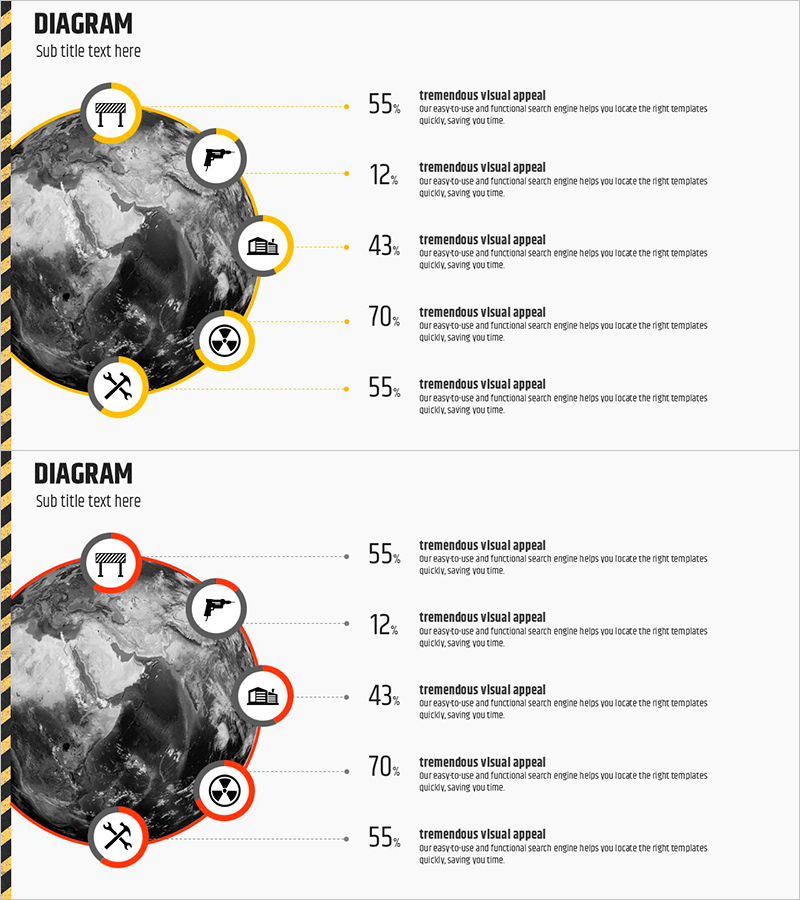
A PowerPoint slide featuring a radial diagram structure where five items expand outward from a central core element. The layout uses a black-and-white globe image at the center, connected to five nodes with icons and numerical data through dotted lines. This design is ideal for visualizing technology development status, business domain progress, organizational role distribution, and strategic initiatives. Yellow or red accent colors highlight each node to clarify information hierarchy, while dotted connectors intuitively express relationships to the center. The 2-slide PPTX file in 16:9 widescreen format is immediately editable and suitable for both presentations and reports.
Usage Points
-
Main Usage
Expresses information structures where a central concept or theme radiates outward into five related items. Effectively visualizes technology development progress, business domain performance, departmental roles, product feature characteristics, and other relationships that expand from center to periphery.
-
How to Use
Place your core subject or company logo in the central image area, then input item names and numerical data into each of the five nodes. Use dotted connectors and icons to differentiate each item's nature, and apply yellow or red accent colors to indicate importance levels. Following the logical flow from center to periphery during presentation enhances audience comprehension.
-
Recommended For
Recommended for technology development team progress reports, business department domain-specific performance presentations, executive strategy briefings, investor business structure explanations, and marketing team channel performance analysis presentations. Particularly useful when comparing and analyzing multiple independent items at equivalent levels.
-
Slide Structure
Two-slide composition with the first slide featuring yellow-accented 5-node radial diagram and the second slide with red-accented identical structure. Each slide comprises a central black-and-white globe image, five circular nodes with icons, dotted connector lines, and numerical data input areas, optimized for 16:9 widescreen format.
Related Products
-

Big Data Development Status Radial Graph – Captivating Visual Appeal
#Product/Service Introduction #Business Introduction #Diagram
-

Technology Achievement Donut Chart
#Product/Service Introduction #Business Introduction #Graph
-

Simple Car Wide Presentation Donut Chart - Perfect Template for Technical Introductions
#Product/Service Introduction #Business Introduction #Graph
-

Global Business Development Status Graph – Vision for Expansion
#Product/Service Introduction #Business Introduction #Graph
