Numerical Connection Diagram – Operational Plan and Marketing Strategy
RJ0900007_27
- Last Update 08/17/2025
- File Size 0MB
- # of Slides 2
- File Format PPTX
- Slide Ratio 16:9
- Color
Keywords
- #Content-Based Slides
- #Design-Based Slides
- #Company Introduction
- #Operational Plan
- #Marketing Plan and Strategy
- #Diagram
- #Text Box
- #Key Achievements
- #Organizational Structure and Staffing Plan
- #Marketing Objectives
- #Cluster
- #Chain Diagram
- #16:9
- #3-node connection diagram PowerPoint
- #numerical data slide template
- #operational planning presentation
- #marketing strategy diagram
- #how to create connection diagram in PowerPoint
About the Product
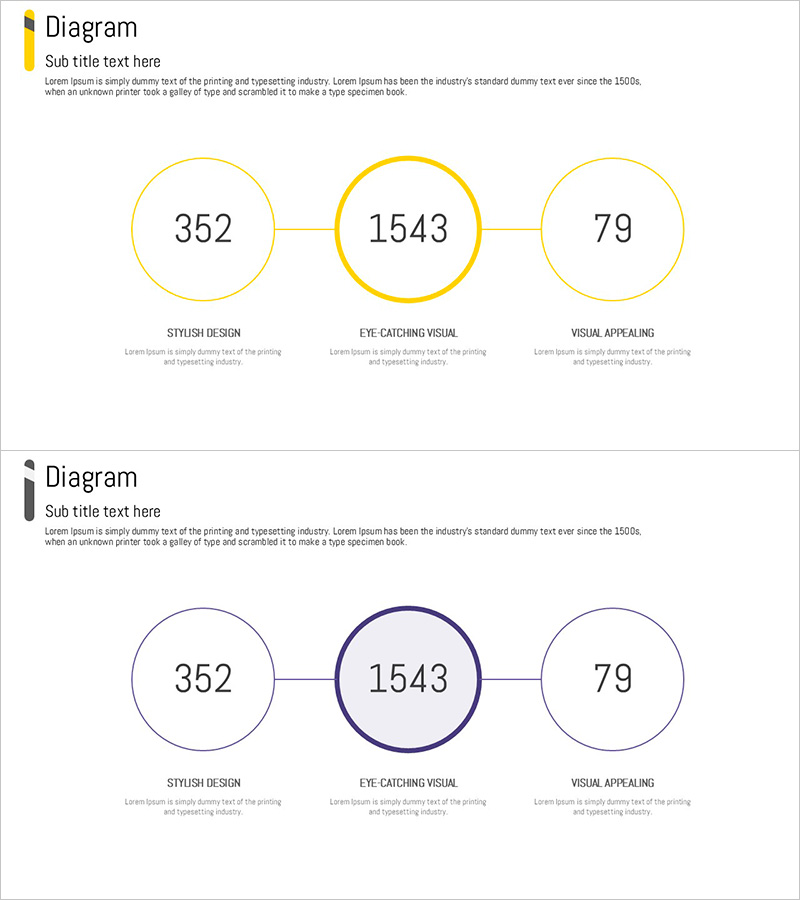
A horizontal 3-node connection diagram PowerPoint slide designed for numerical data visualization and comparative analysis. The center node is highlighted in gold to emphasize the key metric, while left and right nodes display supporting data. Each node accommodates numerical values with item labels and descriptive text below, making it ideal for operational planning, marketing strategy, and performance analysis presentations. Two color versions (gold and navy) are provided to match corporate branding standards.
Usage Points
-
Main Usage
Visualize three key metrics, items, or stages in a horizontal connection structure that simultaneously shows relationships and numerical comparisons. The centered gold node emphasizes the primary metric while flanking nodes clarify comparative elements. Optimized for operational planning (target vs. actual vs. variance), marketing analytics (budget vs. reach vs. conversion), and data-driven decision-making presentations.
-
How to Use
Enter numerical values into each circular node and add item labels with descriptions in the text area below (e.g., Stylish Design, Eye-Catching Visual, Visual Appealing). Select the color version matching your corporate brand identity. With 2 slides provided, arrange them sequentially for comparative analysis sections. Fully editable shapes and text fields allow customization for any business context.
-
Recommended For
Executives, marketing managers, project leaders, and sales directors preparing quarterly/annual performance reviews, strategy planning meetings, and investor reports. Particularly effective for KPI analysis requiring 3-item comparison, marketing channel performance benchmarking, operational efficiency evaluation, and any data-driven communication requiring clear numerical visualization.
-
Slide Structure
2-slide template with 3 circular nodes (approximately 80px diameter) arranged horizontally and connected by lines. Center node in gold (or navy) accent; left and right nodes in lighter tone. Item labels (12pt bold) and descriptive text (10pt regular) positioned below each node. 16:9 widescreen format optimized for modern presentation environments.
Related Products
-

Employment Project Results via Participant Reviews
#Company Introduction #Operational Plan #Customer Success Stories
-

Geometry Pattern Wide Diagram – Product Introduction and Operational Plan
#Product/Service Introduction #Operational Plan #Diagram
-

Connection Diagram and Highlighted Areas – Effective Service Introduction
#Product/Service Introduction #Operational Plan #Technical Approach
-

Vision and Key Message Diagram – Business Vision and Strategy
#Business Vision and Strategy #Marketing Plan and Strategy #Diagram
