Market Trend Analysis Using Stacked Charts – Indoor Lighting
RJ0900005_20
- Last Update 08/17/2025
- File Size 1.2MB
- # of Slides 2
- File Format PPTX
- Slide Ratio 16:9
- Color
Keywords
- #Content-Based Slides
- #Design-Based Slides
- #Market and Competitor Analysis
- #Graph
- #Industry Trends
- #Horizontal Bar
- #Segmented Horizontal Bar
- #16:9
- #stacked bar chart PowerPoint
- #multi-series data visualization slide
- #market trend analysis template
- #year-over-year comparison chart
- #how to create stacked chart in PowerPoint
About the Product
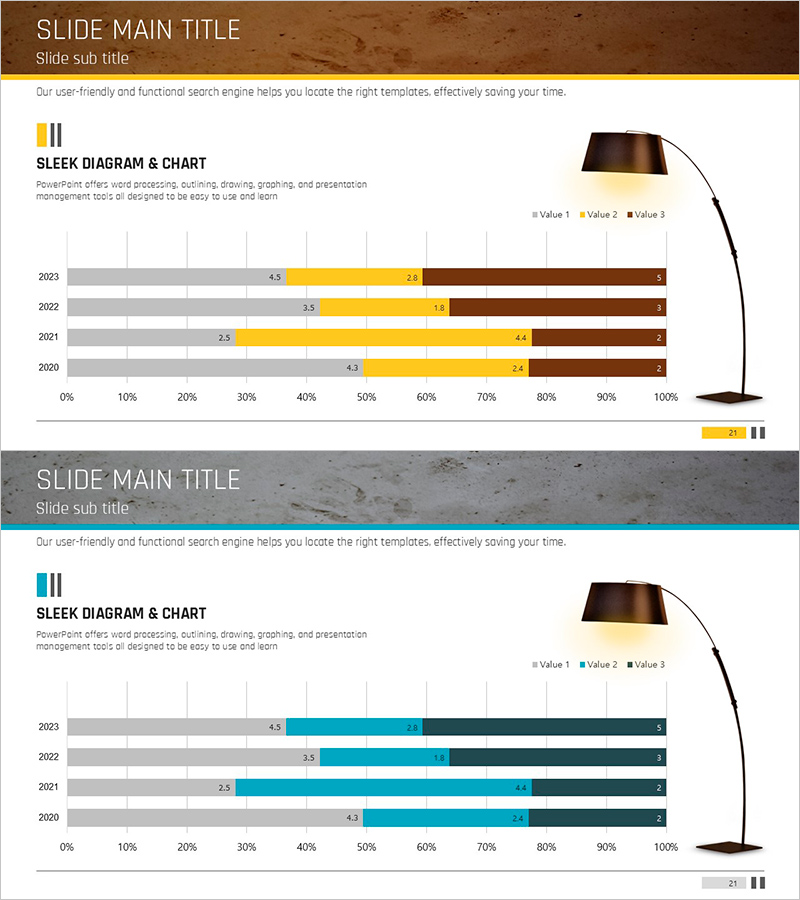
A stacked bar chart PowerPoint slide that visualizes market trends across three data series from 2020 to 2023. The horizontal bar layout uses gray, yellow, and brown colors to clearly distinguish each series, with numerical labels displayed on each segment for precise data comparison. This slide deck is ready to use for market analysis presentations, industry reports, and trend analysis in sectors such as indoor lighting and beyond. Provided in 16:9 widescreen format with 2 slides, fully editable colors and values for seamless customization.
Usage Points
-
Main Usage
Displays multiple data series stacked horizontally to show both total volume and component breakdown simultaneously. Ideal for market trend analysis, sales performance comparison, industry statistics, and any presentation requiring complex multi-category data visualization.
-
How to Use
Simply select the existing data values and replace them with your own figures—the chart updates automatically. Modify colors using the theme color palette, and freely edit legend labels and axis titles. Insert directly into presentations, reports, and business proposals.
-
Recommended For
Marketing professionals, sales analysts, financial reporting teams, management consultants, and industry researchers who need to communicate market data and performance trends persuasively. Particularly effective for strategic planning meetings, investor presentations, and competitive analysis briefings.
-
Slide Structure
Two-slide layout with title area and stacked bar chart section on each slide. The chart displays 4 years (2020–2023) on the X-axis with three stacked series (Value 1, 2, 3) on the Y-axis, using a 0–100% scale. Clear legend and numerical labels ensure easy data interpretation and professional presentation.
Related Products
-

Animal Natural Environment Improvement Rate Future Outlook Horizontal Bar Chart
#Market and Competitor Analysis #Graph #Industry Trends
-

Horizontal Bar Chart for Changes in the Climbing Population – Market Trend Analysis
#Market and Competitor Analysis #Graph #Industry Trends
-

Yellow Green Detailed Analysis Chart - Visualizing Market Trends
#Business Strategy #Market and Competitor Analysis #Diagram
-

Analyzing Flower Horizontal Segmentation Charts – Understanding Market Trends
#Market and Competitor Analysis #Graph #Industry Trends
