Highlight Table Chart – Budget Planning and Performance Tracking
RJ0500002_9
- Last Update 06/08/2025
- File Size 0.5MB
- # of Slides 1
- File Format PPTX
- Slide Ratio 16:9
- Color
Keywords
- #Content-Based Slides
- #Design-Based Slides
- #Business Strategy
- #Financial Plans and Performance
- #Diagram
- #Budget
- #Table
- #Standard Table
- #16:9
- #highlight table PowerPoint slide
- #budget planning presentation
- #performance tracking chart
- #comparison analysis slide
- #financial report template
- #table diagram PowerPoint
- #data visualization slide
About the Product
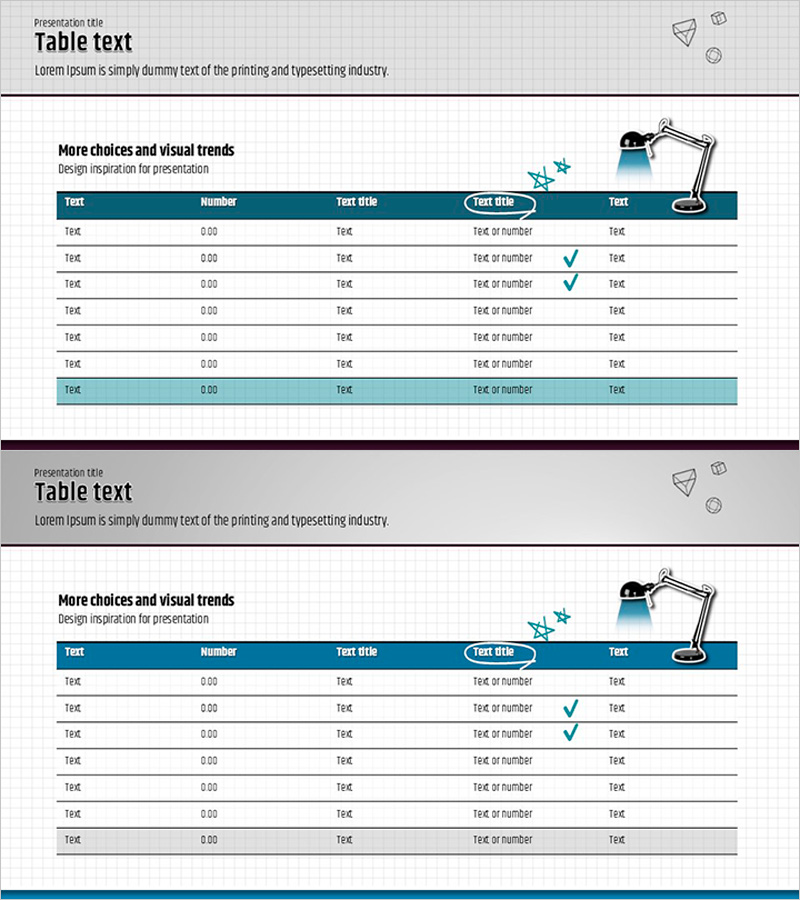
A 5-row highlight table PowerPoint slide designed for budget planning and performance tracking. Features a dark blue header and light gray row backgrounds to clearly distinguish information hierarchy, with checkmark icons visually emphasizing completed items. The 6-column structure accommodates both numerical data and text, making it ideal for financial reports, business progress updates, and budget execution presentations. Provided in 16:9 widescreen PPTX format with fully editable cells, text, and data fields for seamless customization.
Usage Points
-
Main Usage
Clearly presents budget execution status, performance metrics comparison, and financial data organization in tabular format. The dark blue header and light gray row backgrounds create distinct visual separation, while checkmark icons intuitively indicate completion status and progress tracking.
-
How to Use
Apply to financial report budget sections, business progress presentations, and quarterly performance analysis materials. Replace row text and numbers with your own data, and add or remove rows as needed. Checkmark positions and colors are fully customizable to match your presentation requirements.
-
Recommended For
CFOs, finance managers, project managers, and business planning teams presenting budget status, performance tracking, and goal achievement metrics. Ideal for investor reports, executive meetings, and departmental performance sharing sessions requiring credible data visualization.
-
Slide Structure
6-column × 5-row table structure with dark blue header row (Text·Number·Text title·Text title·Text·Text) and 4 light gray data rows. Checkmark icons in circular backgrounds appear in the 4th column of 2 rows, with a desk lamp illustration positioned in the upper right corner for visual balance.
Related Products
-

Slide Template Presenting Text and Numbers – Communication and Efficiency
#Financial Plans and Performance #Diagram #Income Statement
-

Newspaper Wide PowerPoint Template Schedule – Business Strategy
#Business Strategy #Operational Plan #Diagram
-

Budget & Schedule Management Strategy Slide – Data-Driven Planning
#Financial Plans and Performance #Diagram #Graph
-

Yellow Green Detailed Analysis Chart - Visualizing Market Trends
#Business Strategy #Market and Competitor Analysis #Diagram
