Green Orange Table Analysis Chart
RJ0900002_8
- Last Update 08/16/2025
- File Size 0.1MB
- # of Slides 2
- File Format PPTX
- Slide Ratio 16:9
- Color
Keywords
- #Content-Based Slides
- #Design-Based Slides
- #Business Management
- #Operational Plan
- #Diagram
- #Quality Assurance Plan
- #Business Support Plan
- #Table
- #Standard Table
- #Horizontal Table
- #16:9
- #horizontal table PowerPoint
- #table analysis chart presentation
- #item comparison slide
- #business management PPT template
- #operational planning slides
- #quality assurance chart download
About the Product
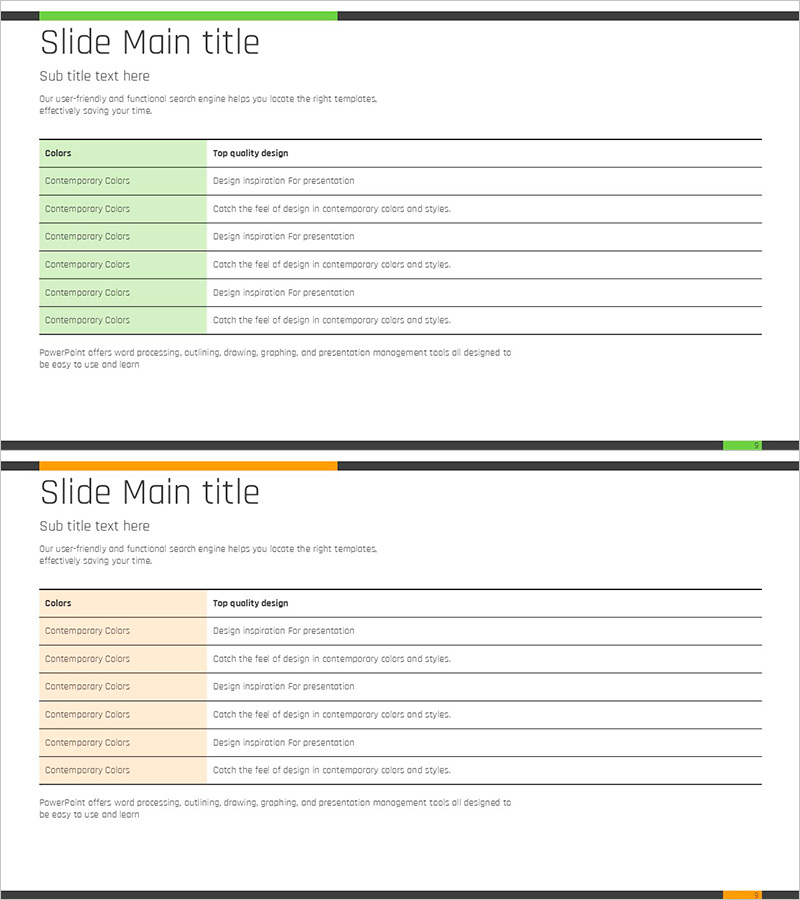
A horizontal table PowerPoint slide featuring green and orange dual-tone color scheme. The design includes 6 rows for comparing and analyzing item characteristics, with a green header on the left for category names and an orange section on the right for descriptive text. This presentation template is ready to use for business management, operational planning, and quality assurance presentations. Available in 16:9 widescreen format, PPTX file type, with 2 slides for easy editing and customization.
Usage Points
-
Main Usage
Organize data items in rows to compare characteristics, performance, and standards at a glance. The left-right contrast structure systematically arranges complex information and enhances audience comprehension during data-driven presentations.
-
How to Use
Use in business management meetings, operational planning reports, and quality assurance reviews as a comparison analysis section. Edit each row's text with actual item names and descriptions, and add or remove rows as needed for customization.
-
Recommended For
Project managers, operations team leaders, quality assurance specialists, and business planners who require data-driven decision-making. Ideal for regular status reports, performance reviews, and process improvement proposals in internal meetings.
-
Slide Structure
6-row × 2-column horizontal table layout. Left side features green header background for category input, right side has orange background for description area. Each row is independently editable with title area at top and descriptive text area at bottom.
Related Products
-

Bio Innovation Solutions – Effective Design for Operational Planning
#Operational Plan #Diagram #Graph
-

Presentation Slide Visualizing Company Performance with Column Chart
#Company Introduction #Market and Competitor Analysis #Diagram
-

Color-highlighted Bar Graphs and Tables – Optimized for Financial Analysis
#Financial Plans and Performance #Diagram #Graph
-

Detail Check Box Table for Operational Planning – Useful Visual Aid
#Operational Plan #Technical Approach #Diagram
