Real Estate Brokerage Diagram for Marketing Strategy Visualization
RJ0900002_5
- Last Update 08/16/2025
- File Size 0.1MB
- # of Slides 2
- File Format PPTX
- Slide Ratio 16:9
- Color
Keywords
- #Content-Based Slides
- #Design-Based Slides
- #Business Management
- #Marketing Plan and Strategy
- #Diagram
- #Execution Plan
- #Marketing Strategy
- #Flow
- #Cluster
- #Linear Flow
- #Closed Cluster Diagram
- #16:9
- #closed-loop diagram PowerPoint
- #3-step process diagram slide
- #real estate marketing presentation
- #business workflow diagram
- #customer journey PowerPoint template
About the Product
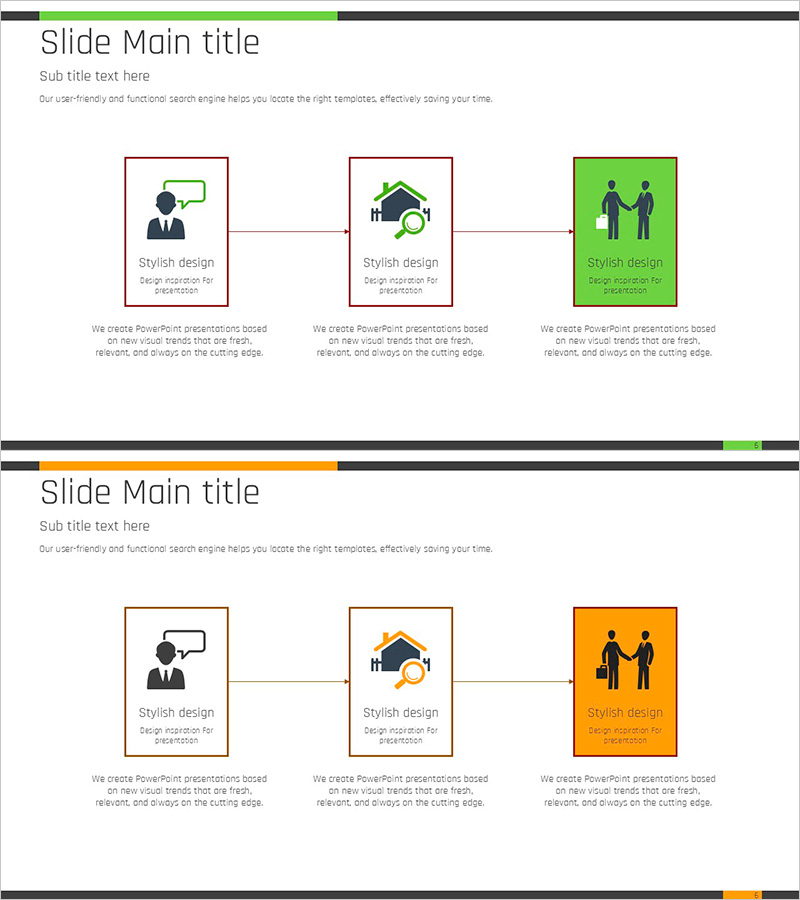
A 3-step closed-loop diagram PowerPoint slide designed to visualize real estate brokerage marketing strategy and customer acquisition process. The slide illustrates sequential stages—customer discovery, information search, and customer connection—using icons and text boxes with directional arrows showing cause-and-effect relationships. The design employs a green accent background with brown-bordered boxes to establish clear information hierarchy. Includes 2-slide variations in green and orange color schemes, suitable for business presentations, sales reports, and strategic planning documents.
Usage Points
-
Main Usage
Optimized for explaining real estate brokerage marketing strategies and customer acquisition workflows step-by-step. Ideal for sales strategy presentations, team training materials, and business plans where each stage of the customer journey must be clearly communicated to enhance audience comprehension.
-
How to Use
Customize text in each stage box to match your specific marketing process and replace icons with industry-relevant images. During presentations, follow the arrow sequence to guide audiences through each stage logically. The slide is also print-ready for distribution as hard-copy materials.
-
Recommended For
Real estate sales teams, marketing managers, business development professionals, and consultants explaining customer acquisition strategies. Applicable for new employee training, executive briefings, client presentations, and strategic planning sessions across various business contexts.
-
Slide Structure
Three nodes (customer discovery, information search, customer connection) connected linearly from left to right in a closed-loop configuration. Each node combines an icon with a text input area, connected by directional arrows indicating sequential progression. Green accent boxes and brown borders establish visual information hierarchy.
Related Products
-

Visualizing Service Marketing Strategy and Plan Slide
#Business Strategy #Business Management #Marketing Plan and Strategy
-

Strategies for Empathy and Effective Dialogue – Mastering Communication Crafts
#Business Management #Operational Plan #Diagram
-

Business Strategy Structure Diagram – Strategic Visualization for Success
#Business Vision and Strategy #Marketing Plan and Strategy #Diagram
-

Marketing Mix 4P Diagram – Effective Promotion Strategy
#Marketing Plan and Strategy #Diagram #Promotion Strategy
