Ball Game Preference Analysis Graph – Competition and Challenge
RL0100091_7
- Last Update 01/23/2025
- File Size 1.8MB
- # of Slides 2
- File Format PPTX
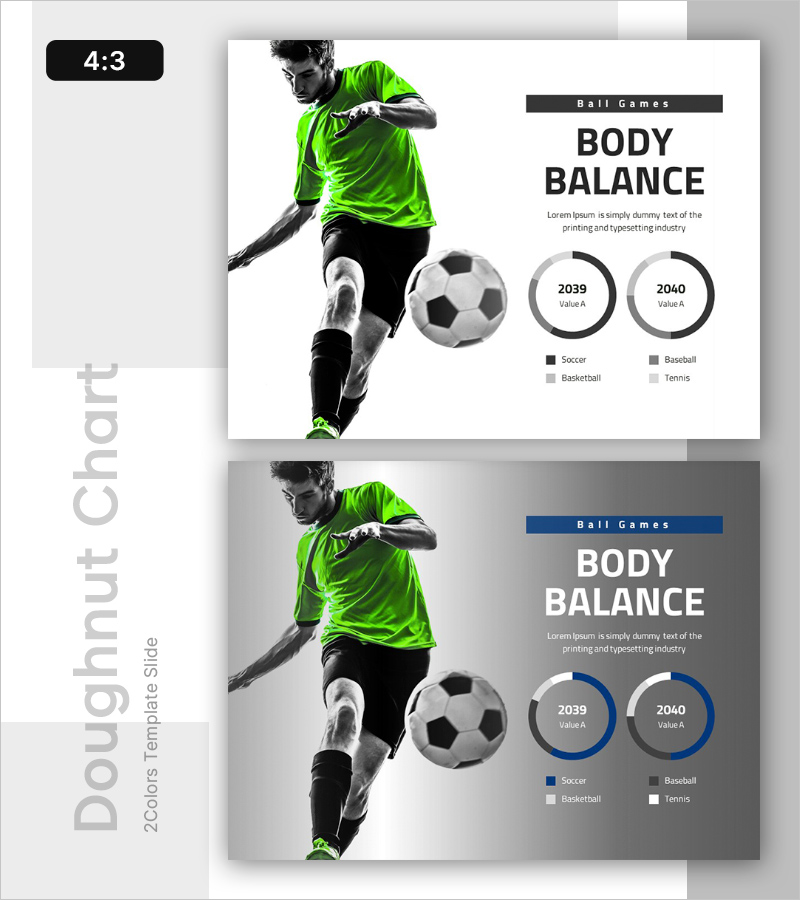
- Slide Ratio 4:3
- Color
Keywords
About the Product
A PowerPoint slide that visually compares and analyzes preference for ball sports including soccer, baseball, basketball, and tennis. The slide features a pie chart displaying preference distribution across four sports, with two design options: white background and dark gray background. The layout places an athlete image on the left and data visualization on the right, maximizing information clarity. Each slide includes a title, descriptive text, and legend for complete presentation readiness. Ideal for marketing analysis, business reports, and executive presentations. Provided in 4:3 aspect ratio PPTX format, fully editable in all PowerPoint versions.
Usage Points
-
Main Usage
Supports data-driven decision-making for sports market analysis, consumer preference surveys, and competitive sport comparison. The pie chart intuitively conveys the relative market share of each sport, making it ideal for marketing strategy, business planning, and market analysis report presentations.
-
How to Use
Double-click the chart to replace data with your actual figures. Edit the title, description text, and legend using text boxes. Customize colors, fonts, and layout as needed. Choose between white or dark background options to match your presentation style.
-
Recommended For
Recommended for marketing team market analysis presentations, executive reports, sports industry analysis, consumer research findings, and business proposal market overview sections. Suitable for any business presentation requiring data-driven insights.
-
Slide Structure
Two-slide set with each slide divided into left image area (athlete photo) and right information area (title, description, pie chart, legend). Contains four information layers: one title, one descriptive text, one pie chart, and one legend, with two background design options.


