Food Ingredient Horizontal Subdivision Graph – Market Trend Analysis
RJ0800046_10
- Last Update 08/13/2025
- File Size 0.1MB
- # of Slides 2
- File Format PPTX
- Slide Ratio 16:9
- Color
Keywords
- #Content-Based Slides
- #Design-Based Slides
- #Market and Competitor Analysis
- #Graph
- #Industry Trends
- #Horizontal Bar
- #Segmented Horizontal Bar
- #16:9
- #horizontal subdivision bar chart PowerPoint
- #multi-series chart slide template
- #market analysis graph
- #data comparison chart
- #4-series bar graph template download
About the Product
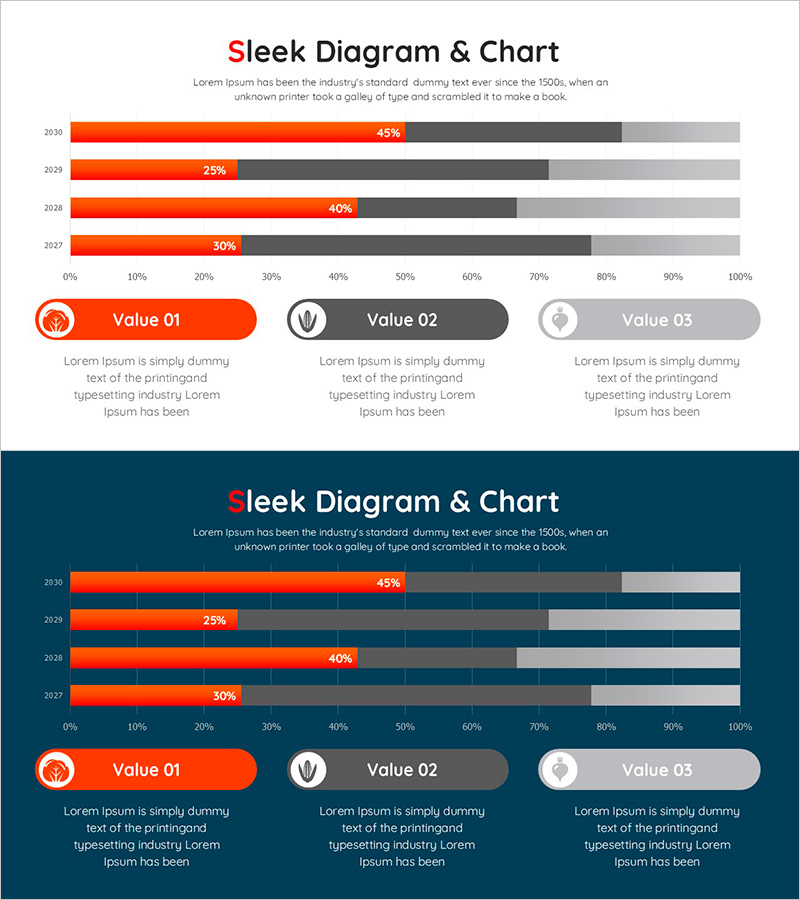
A horizontal subdivision bar chart PowerPoint slide designed to compare and analyze data across 4 series simultaneously. The slide features an orange accent series paired with gray and charcoal supporting series, visualizing year-over-year trends from 2027 to 2030. Each year displays 4 values (45%, 25%, 40%, 30%) enabling clear representation of market share, sales volume comparison, growth rate analysis, and other business metrics. The 2-slide set includes both light background and dark background versions, allowing you to match your presentation environment and document tone.
Usage Points
-
Main Usage
Use this slide when comparing 4 or more data series across years or categories simultaneously. Ideal for visualizing market share distribution, sales channel revenue, product category growth rates, regional profit composition, and other complex datasets at a glance.
-
How to Use
Modify the bar lengths and colors to match your actual data values. Replace the legend labels (Value 01, 02, 03) and year indicators, input your percentage figures, then add your title and descriptive text. The slide is ready for immediate use in presentations.
-
Recommended For
Perfect for marketing strategy presentations, business reports, investor pitch decks, market analysis reports, and quarterly or annual performance presentations. Commonly used by sales teams, planning departments, finance teams, and executive-level reporting.
-
Slide Structure
2-slide set featuring horizontal subdivision bar charts with 4 data series + 3-item legend (orange, gray, light gray icons) + year-by-year data display (2027–2030, 4-row structure). Available in both light background and dark navy background versions for flexible presentation use.
Related Products
-

Eco-friendly Business Market Share Segmentation Horizontal Bar Chart
#Market and Competitor Analysis #Graph #Industry Trends
-

Paint Piano and Segmentation Bar Graph – Market Trend Analysis
#Market and Competitor Analysis #Graph #Market Analysis
-

Bar Chart for Eco-friendly Practices Trends Visualization
#Market and Competitor Analysis #Graph #Industry Trends
-

Yellow Green Detailed Analysis Chart - Visualizing Market Trends
#Business Strategy #Market and Competitor Analysis #Diagram
