Product-specific Description Box – Cluster Design with Visual Appeal
RJ0800034_22
- Last Update 08/09/2025
- File Size 1.5MB
- # of Slides 2
- File Format PPTX
- Slide Ratio 16:9
- Color
Keywords
- #Content-Based Slides
- #Design-Based Slides
- #Product/Service Introduction
- #Diagram
- #Program Introduction
- #Development Status
- #Cluster
- #Closed Cluster Diagram
- #16:9
- #product description box PowerPoint
- #cluster diagram slide template
- #product introduction slide
- #3-section layout PPT
- #visual explanation template
About the Product
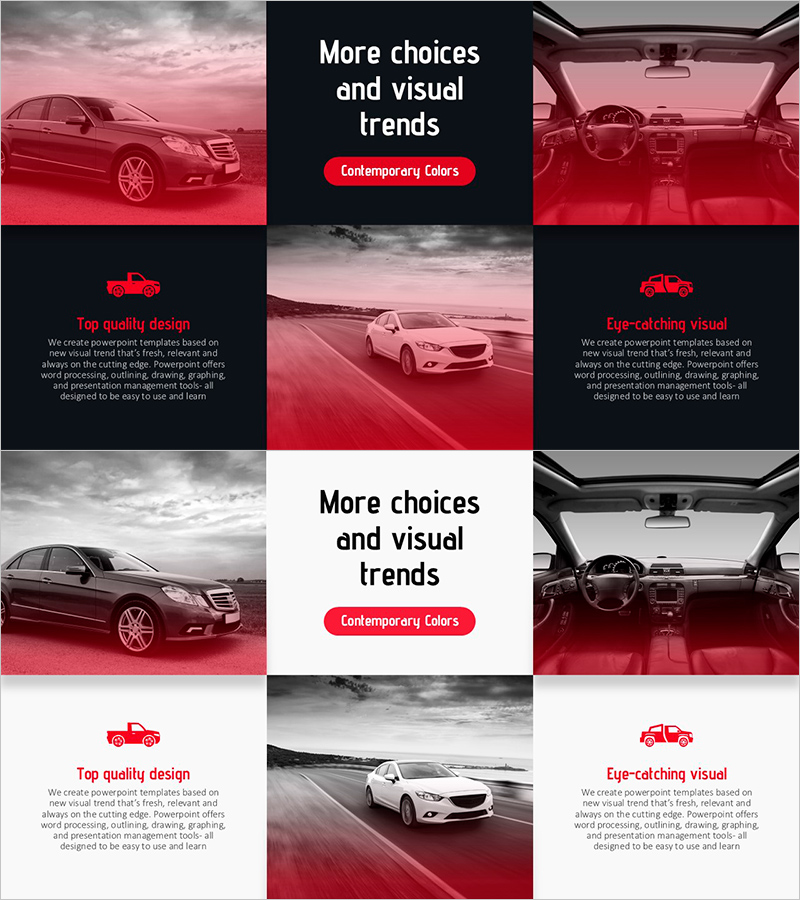
A 2-slide set optimized for automotive product presentations. This cluster diagram uses pink, black, and gray tones to create visual contrast and guide attention to three distinct product feature areas. The balanced layout combines a left image zone, center text box, and right description area to enhance presentation professionalism. Built with standard PowerPoint shapes and text boxes for immediate editing, this slide deck works well for product introductions, marketing pitches, and sales materials.
Usage Points
-
Main Usage
This slide presents product or service features organized into three distinct categories. The left image area holds product photos, while the center and right boxes contain text for functions, benefits, and specifications, enabling quick comparison at a glance.
-
How to Use
Use this slide in the key features section of product introduction presentations. Simply input title and description text in each box, then replace the left image with your product photo. Ideal for marketing pitches, sales meetings, and product catalog creation.
-
Recommended For
Recommended for automotive, appliance, fashion, and technology product presentations, sales team client persuasion materials, product comparison sections in marketing proposals, and product catalog or brochure design. Especially effective when highlighting three main features.
-
Slide Structure
The 2-slide set features a divided layout with a left image area (1 zone) and right text box area (3 boxes) per slide. The top center displays 'More choices and visual trends' with a 'Contemporary Colors' tag, with each box distinguished by pink, black, and gray tones.
Related Products
-

Market Share Donut Pie Chart – Insightful Data Visualization
#Product/Service Introduction #Diagram #Graph
-

Introduction to Artificial Intelligence Robot Business Services – Innovative Solutions
#Product/Service Introduction #Diagram #Product/Service Introduction
-

Hexagon Photo and Descriptive Text Slide – Key Format for Product Introduction
#Product/Service Introduction #Diagram #Product/Service Introduction
-

Big Data Development Goals Slide Template – Vision and Strategy
#Product/Service Introduction #Business Vision and Strategy #Diagram
