Transportation Diffusion Diagram
RJ0800029_27
- Last Update 08/08/2025
- File Size 0.3MB
- # of Slides 2
- File Format PPTX
- Slide Ratio 16:9
- Color
Keywords
- #Content-Based Slides
- #Design-Based Slides
- #Business Introduction
- #Diagram
- #Business Areas
- #Technological Status
- #Spread
- #Centralized Diagram
- #16:9
- #radial diagram PowerPoint
- #diffusion diagram slide template
- #6-node diagram presentation
- #transportation industry PowerPoint
- #central diagram template
- #how to create radial diagram in PowerPoint
About the Product
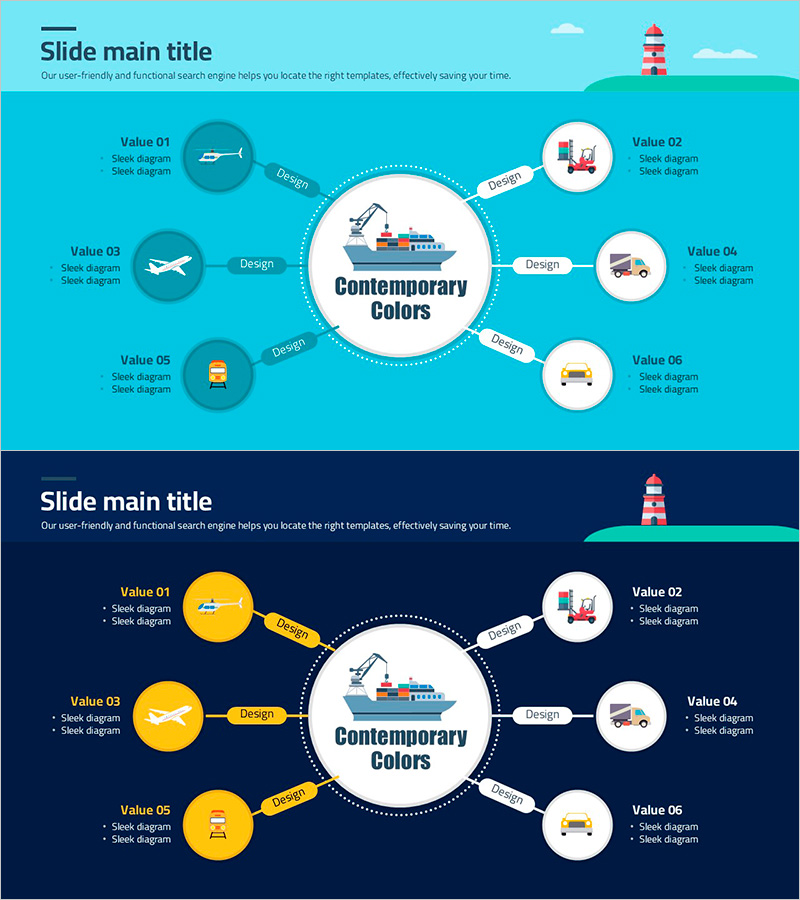
A radial diffusion diagram PowerPoint slide featuring a central concept expanding to 6 surrounding nodes. Provided in two color versions: light turquoise and dark navy backgrounds, each node includes icons and text areas for customization. Optimized for transportation, logistics, and shipping industry presentations to visually organize core values, services, and business functions. Delivered in 16:9 widescreen PPTX format, fully editable with flexible color, icon, and text customization options.
Usage Points
-
Main Usage
Expands a central concept into 6 surrounding elements, ideal for presenting core values, services, functions, and competitive advantages. Commonly used in transportation, logistics, shipping, and delivery industry presentations to visually communicate business scope, service range, and key capabilities.
-
How to Use
Enter the core concept (company name, service name, or brand) in the central circle. Add item names and descriptions to each of the 6 nodes. Customize icons to reflect each item's characteristics, and adjust colors, line styles, and text sizes to emphasize key points.
-
Recommended For
Transportation, logistics, shipping, delivery, aviation, and maritime industry professionals. Marketing, sales, and business development teams presenting company overviews and service explanations. Executives and consultants who need to clearly communicate business scope, competitive advantages, and value propositions.
-
Slide Structure
2-slide set: Slide 1 features light turquoise background with 6 dark teal circular nodes and white central circle. Slide 2 features dark navy background with 6 bright yellow circular nodes and white central circle. Each node contains an icon, text label, and description area, connected to the center by dotted lines with 'Design' labels.
Related Products
-

4 Strategic Keywords to Achieve Goals
#Business Introduction #Diagram #Business Areas
-

Sewing Button Diagram – Business Area and Technical Status
#Business Introduction #Diagram #Business Areas
-

Key Chemical Composition Charts for Effective Data Visualization
#Business Introduction #Diagram #Business Areas
-

Medical Diffusion Diagram – Conveying Business Strategy and Vision
#Business Introduction #Business Vision and Strategy #Diagram
