Key Chemical Composition Charts for Effective Data Visualization
RJ0400002_11
- Last Update 05/17/2025
- File Size 1.9MB
- # of Slides 2
- File Format PPTX
- Slide Ratio 16:9
- Color
Keywords
- #Content-Based Slides
- #Design-Based Slides
- #Business Introduction
- #Diagram
- #Business Areas
- #Technological Status
- #Cluster
- #Spread
- #Chain Diagram
- #Centralized Diagram
- #16:9
- #donut diagram PowerPoint
- #circular cycle diagram slide
- #3-stage process flow chart
- #center-focused diagram template
- #cycle visualization PowerPoint slide
About the Product
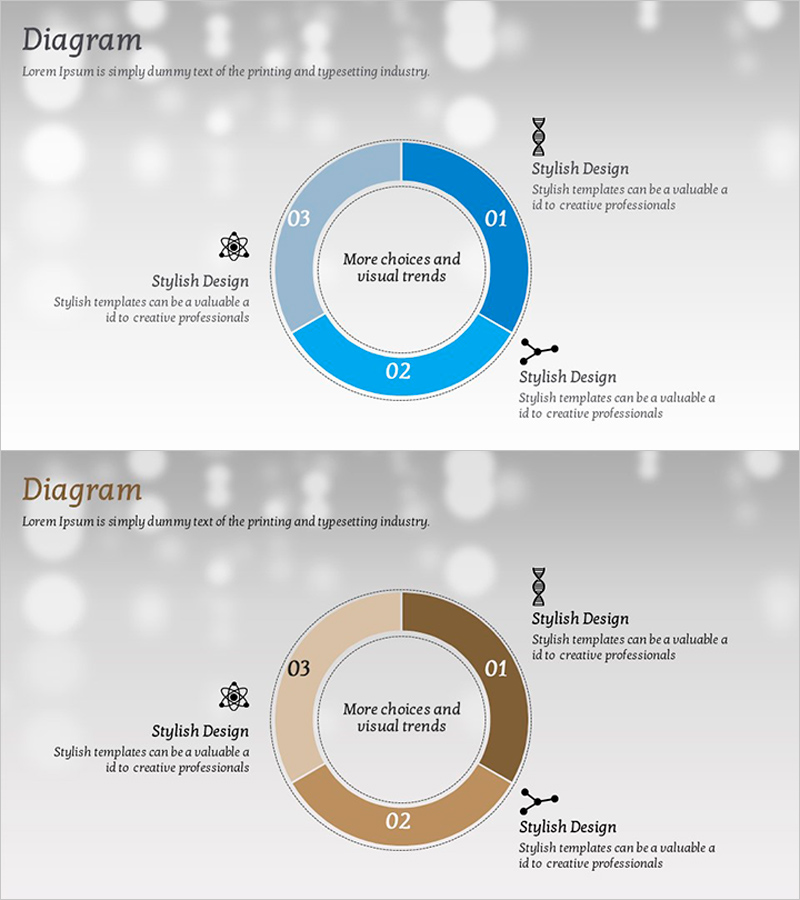
A professional donut-shaped circular diagram PowerPoint slide set featuring a 3-segment cycle structure with center emphasis. This 2-slide template is available in two color versions: blue and beige tones, each designed to highlight a central message while displaying three surrounding elements. The layout includes numbered sections (01, 02, 03), icon placeholders, and text areas for detailed descriptions. The soft gray background with bokeh effect creates a polished presentation environment. Each segment is clearly defined with curved borders and distinct color blocks, making it ideal for visualizing processes, cycles, workflows, and circular relationships in business presentations, product introductions, and technical overviews.
Usage Points
-
Main Usage
Designed to emphasize a central concept while illustrating the cyclical relationship between three surrounding elements or stages. Perfect for demonstrating business processes, product development cycles, organizational workflows, marketing funnels, customer journeys, and any circular or iterative structure that requires visual clarity.
-
How to Use
Enter your core message or concept in the center circle, then populate each of the three outer segments with corresponding stages, phases, or components. Customize the numbered labels, icons, and descriptive text to match your presentation content. Select either the blue or beige color version based on your corporate branding guidelines and presentation theme.
-
Recommended For
Ideal for business strategists, product managers, marketing professionals, sales executives, and organizational leaders presenting process flows, development cycles, operational structures, campaign frameworks, technology roadmaps, and customer experience analyses. Suitable for corporate presentations, strategic planning sessions, and technical briefings.
-
Slide Structure
2-slide set with 16:9 widescreen format. Each slide features a central circular text area surrounded by three curved segments arranged in a donut pattern. Every segment includes space for a number label, icon, title, and descriptive text. The balanced composition ensures visual hierarchy with the center element as the focal point.
Related Products
-

Circular Puzzle Diagram – Infographic for Business Introduction
#Company Introduction #Business Introduction #Diagram
-

Atomic Structure Science Diagram – Visualizing the Essence of Science
#Company Introduction #Business Introduction #Diagram
-

Data Security Business Area Diagram
#Business Introduction #Business Vision and Strategy #Diagram
-

Business Area Hexagon Diagram – Business Positioning
#Company Introduction #Business Introduction #Diagram
