Human Greed Analysis Graph – Lessons in Excess
RL0100079_4
- Last Update 01/22/2025
- File Size 3.7MB
- # of Slides 2
- File Format PPTX
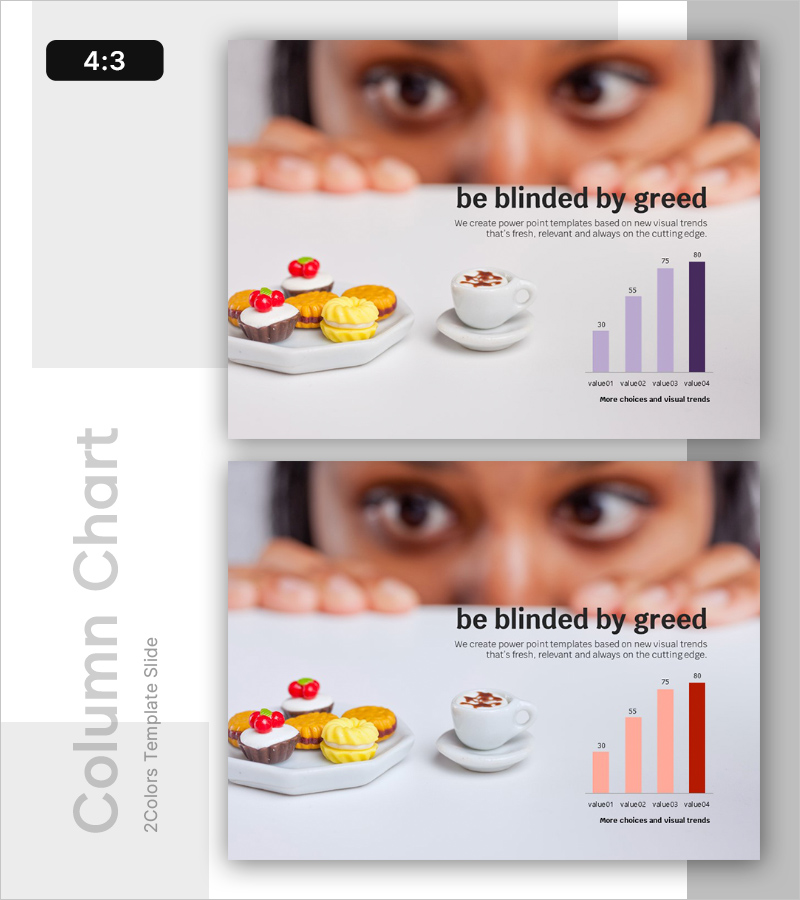
- Slide Ratio 4:3
- Color
Keywords
About the Product
A 2-slide PowerPoint presentation that visualizes human greed and market psychology through comparative data analysis. Features dual-color vertical bar charts in purple and coral tones displaying four data points with values ranging from 30 to 80, paired with lifestyle imagery on the left side to reinforce the emotional message. Delivered in 4:3 aspect ratio PPTX format with fully editable elements, ideal for executive presentations, market analysis reports, and risk management discussions where psychological insights and cautionary lessons about excess are central to the narrative.
Usage Points
-
Main Usage
Analyze the consequences of human greed and excess through quantitative data visualization, demonstrating market psychology shifts via comparative bar charts to support decision-making. Effectively communicates risk awareness and strategic lessons to executives, investors, and stakeholders.
-
How to Use
Replace the left-side imagery with your company logo or additional visual assets, update the bar chart values with your actual data points, and customize the title and subtitle to match your organizational context. Deploy in executive briefings, investor presentations, and risk management forums.
-
Recommended For
Executives, CFOs, risk managers, and investor relations professionals explaining market psychology trends and the dangers of excess. Particularly suited for financial services, insurance, consulting, and manufacturing sectors where risk management and strategic foresight are critical.
-
Slide Structure
Two-slide layout with each slide divided into left image zone (customizable for logos and visuals) and right content zone. Vertical bar charts display four data categories (value01 through value04) with values scaled 30–80, complete with axis labels and legend for clear data interpretation.
Related Products
-

Business Failure Analysis Graph – Essential Tool for Market and Competitor Analysis
#Emotional Messages
-

Business Failure Preparedness Template Cover
#Emotional Messages
-

Product Launch Slide Featuring Warning Signals
#Emotional Messages
-

Success Strategies for Overcoming Failure – Innovative Approach
#Emotional Messages
