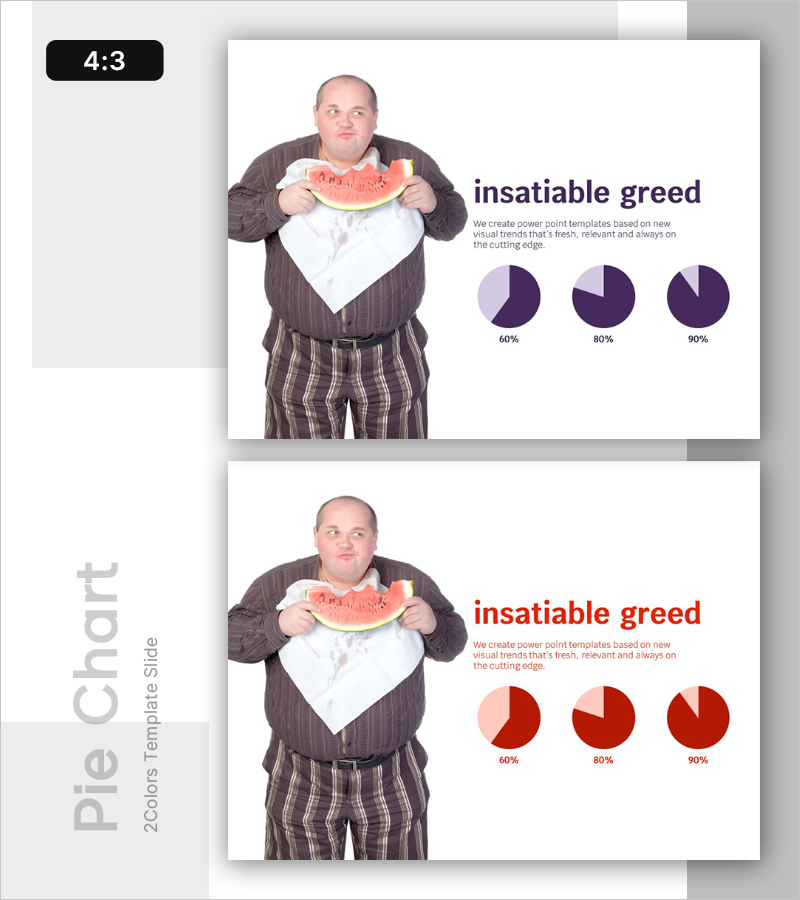
Pie Chart for Market Share Analysis – Symbol of Greed
RL0100079_3
- Last Update 01/22/2025
- File Size 1MB
- # of Slides 2
- File Format PPTX
- Slide Ratio 4:3
- Color
Keywords
About the Product
A PowerPoint pie chart slide designed for market analysis and share comparison. This 4:3 ratio 2-slide set features two color themes (purple and red) supporting three-stage data visualization at 60%, 80%, and 90% levels. The layout separates left image area from right text section, enabling simultaneous display of descriptive content and charts. Immediately applicable for market overview analysis, competitor benchmarking, business performance reporting, and various presentation scenarios requiring data-driven insights.
Usage Points
-
Main Usage
This data visualization slide enables clear market overview analysis and competitor share comparison. The pie chart intuitively represents market size and your company's position relative to competitors, effectively communicating market standing to investors, employees, and business partners during presentations.
-
How to Use
Place relevant images or icons on the left side and enter analysis content in the right text area. Replace pie chart values with actual market data to represent share percentages. Choose between purple or red color themes to match your presentation's overall tone and branding.
-
Recommended For
Ideal for business plans, investor pitch decks, quarterly performance reports, and executive briefings requiring market analysis sections. Suitable for marketing strategy documents' market overview, new business proposals' competitive landscape analysis, and strategic planning presentations.
-
Slide Structure
The 2-slide set features consistent layout with left image area (1 space), right text section (1 title + 1 body area), and pie chart visualization area (3 charts per slide). 4:3 aspect ratio ensures compatibility with existing presentation standards and legacy systems.


