White Black Analysis Table for Comparative Analysis
RJ0800025_14
- Last Update 08/06/2025
- File Size 2.9MB
- # of Slides 2
- File Format PPTX
- Slide Ratio 16:9
- Color
Keywords
About the Product
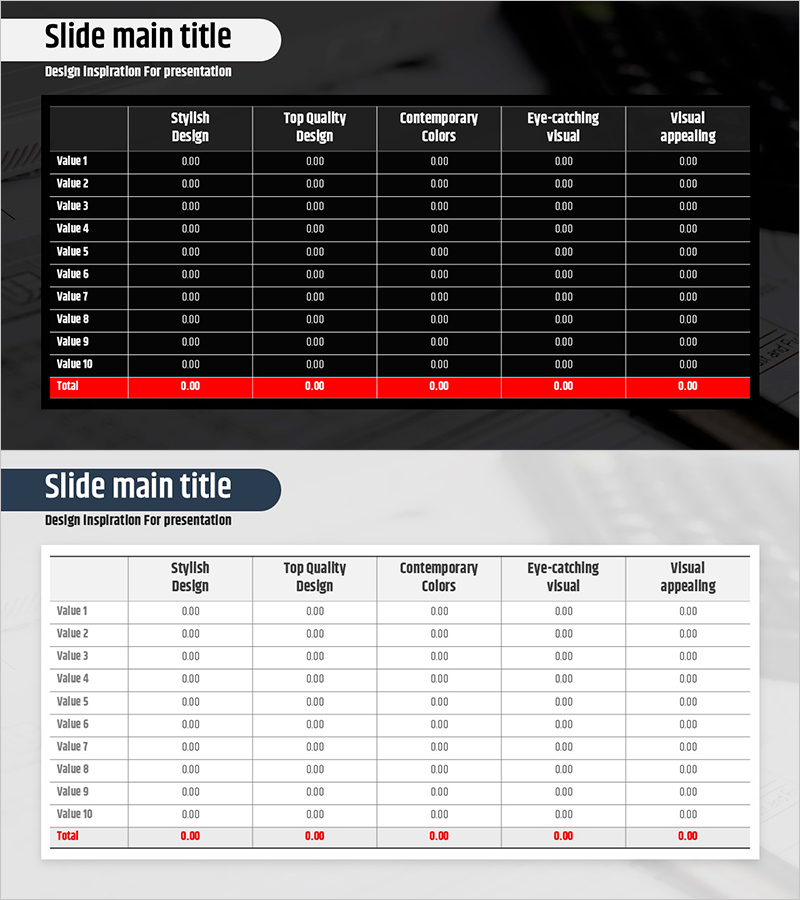
A table diagram PowerPoint slide designed for systematic comparison and analysis of two or more alternatives. The dual-tone design combines white background with black header for strong visual contrast, allowing you to compare 10 items across 6 evaluation criteria at a glance. Each cell supports flexible input of numbers, text, and icons, while a red highlight row emphasizes totals and conclusions. This presentation slide is ready to use immediately for business decision-making, product comparison, performance evaluation, and competitive analysis.
Usage Points
-
Main Usage
Supports objective comparison of two or more alternatives, products, or strategies using structured evaluation criteria. The matrix layout with 10 items and 6 criteria clearly expresses relationships between information points for informed decision-making.
-
How to Use
Enter evaluation criteria (design style, quality, color, visual appeal, etc.) in the header row and comparison targets (product names, strategy names, candidates) in the left column. Fill each cell with scores, ratings, or checkmarks to complete the analysis table. Use the red total row to highlight final conclusions.
-
Recommended For
Ideal for executives, planning teams, marketing departments, and product development teams during strategy formulation, product selection, and vendor evaluation. Suitable for business plans, proposals, performance reports, and management meetings where quantitative comparison is essential.
-
Slide Structure
Two-slide set: First slide features dark background with white text and red highlight row; second slide uses light gray background with dark header and white cells. Both maintain identical 10-row (title + 9 data rows) × 6-column (item name + 5 criteria) table structure for consistency.
Related Products
-

PowerPoint Template for Service Operation Strategy Presentation
#Business Management #Operational Plan #Technical Approach
-

Business Competency Circular Diagram – Visualizing Core Strategies
#Product/Service Introduction #Business Vision and Strategy #Diagram
-

Cooperative Business Vision and Mission – Visualizing Corporate Values
#Company Introduction #Business Vision and Strategy #Diagram
-

Innovative Diagram for Food Ingredient Composition
#Technical Approach #Diagram #Service Architecture Diagram
