Cluster Diagram Visualizing Causes of Stress – Presenting Solutions
RJ0800025_11
- Last Update 08/06/2025
- File Size 1.2MB
- # of Slides 2
- File Format PPTX
- Slide Ratio 16:9
- Color
Keywords
- #Content-Based Slides
- #Design-Based Slides
- #Business Vision and Strategy
- #Operational Plan
- #Diagram
- #Core Competencies
- #Mitigation Measures
- #Cluster
- #Spread
- #Closed Cluster Diagram
- #Centralized Diagram
- #16:9
- #cluster diagram PowerPoint
- #radial diagram slide template
- #central hub diagram
- #cause analysis PowerPoint
- #problem visualization slide
- #6-item diagram template
- #how to create cluster diagram in PowerPoint
About the Product
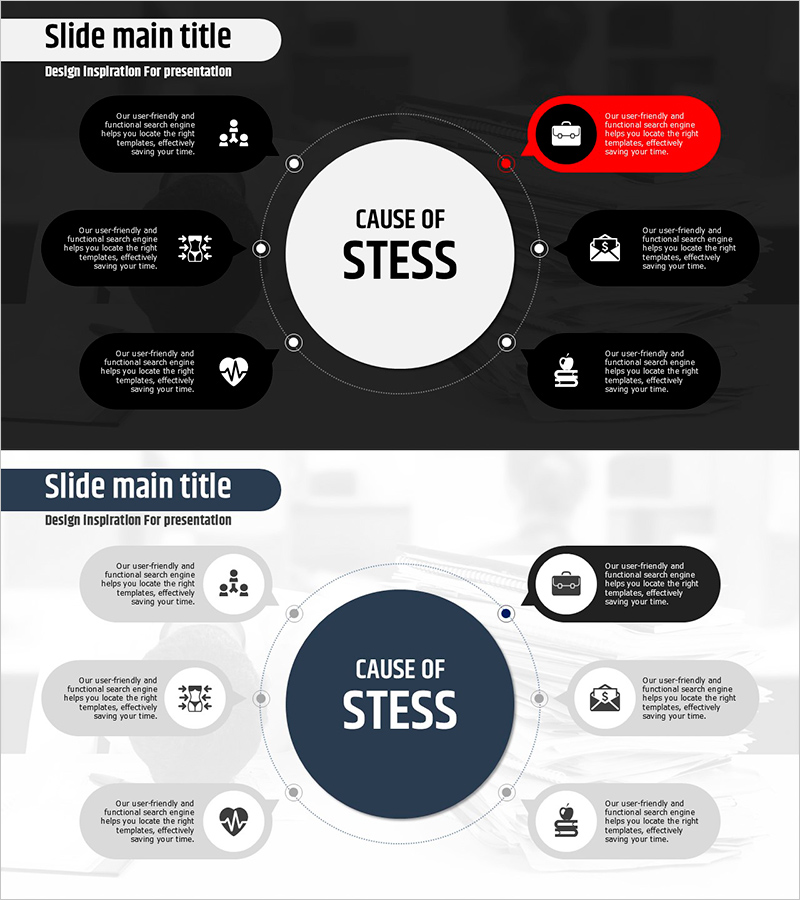
A radial cluster diagram PowerPoint slide with a central white circle connected to six surrounding callout boxes arranged in a circular pattern. The design features a dark background with white typography, black speech bubbles, and distinct icons for each item to enhance visual differentiation. This slide template is ideal for analyzing stress causes, organizing problem factors, presenting solutions, and mapping relationships between a central concept and multiple supporting elements. The 2-slide set includes both dark and light theme versions, allowing you to select the design that best matches your presentation environment and brand identity.
Usage Points
-
Main Usage
Visualizes a central concept or problem with multiple related factors, causes, or solutions arranged radially around it. Commonly used for stress cause analysis, business problem decomposition, root cause identification, solution mapping, and any presentation requiring clear center-to-periphery relationships.
-
How to Use
Enter your main topic or problem statement in the central white circle. Add related items, causes, or solutions to the six surrounding callout boxes with supporting text. Customize the icons in each box to match your content theme, and adjust colors if needed to align with your presentation branding.
-
Recommended For
Executives presenting strategic initiatives, HR professionals discussing organizational challenges, management consultants analyzing business problems, educators breaking down learning objectives, and project managers identifying risk factors. Effective for any role requiring multi-factor analysis or relationship mapping.
-
Slide Structure
Central white circular area for main topic, surrounded by six black or gray callout boxes positioned radially around the center. Each box contains an icon placeholder and text input area, connected to the center by dotted lines. Includes two complete slide layouts: dark theme (black background) and light theme (white background) for flexible presentation use.
Related Products
-

Sea Turtle Protection Diagram Slide
#Business Vision and Strategy #Operational Plan #Diagram
-

Wood Illustration Overview Slide – Business Vision and Strategy
#Business Vision and Strategy #Diagram #Core Competencies
-

Diagram of COVID-19 Quarantine Guidelines – Essential Guide for a Safe Society
#Business Vision and Strategy #Operational Plan #Diagram
-

Sea Closed Diffusion Diagram – Business Vision and Strategy
#Product/Service Introduction #Business Vision and Strategy #Diagram
