Analysis Graph of Gambling Users' Status
RL0100076_4
- Last Update 01/22/2025
- File Size 2.1MB
- # of Slides 2
- File Format PPTX
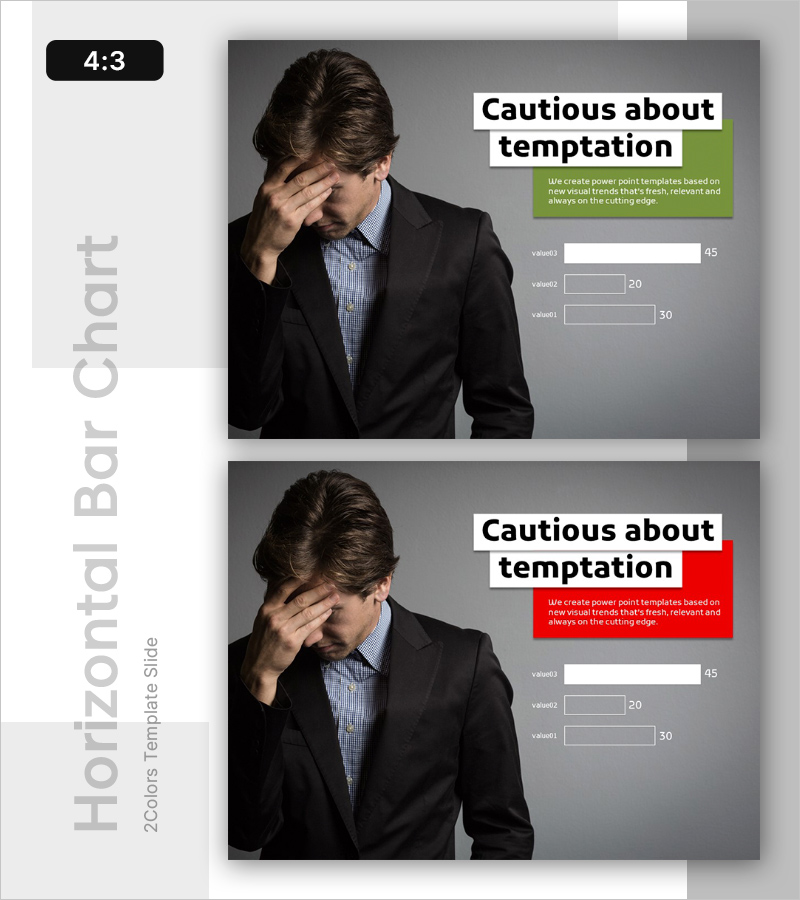
- Slide Ratio 4:3
- Color
Keywords
About the Product
An essential PowerPoint slide for risk management and crisis response presentations. Use this slide to visually analyze and communicate negative factors such as corporate risks, addiction issues, and financial threats. The layout features a two-column design with image placement on the left and title and descriptive text on the right, highlighted by green and red accent boxes that emphasize key messages. Three data input fields at the bottom allow you to immediately incorporate actual statistics and metrics. This presentation slide is ready to apply across various documents including reports, analyses, and business presentations.
Usage Points
-
Main Usage
This slide presents organizational risks, crisis situations, and negative trends through data-driven analysis to decision-makers. It is used for various risk analysis presentations including addiction issues, financial threats, and market vulnerabilities.
-
How to Use
Insert a relevant photo or image on the left side, then enter your analysis topic in the title field on the right. Modify the descriptive text within the highlight boxes and input actual statistics or data into the three numeric fields at the bottom. Use green and red boxes to distinguish between positive and negative factors.
-
Recommended For
Risk management professionals, audit departments, policymakers, financial institution executives, insurance analysts, and social researchers use this slide when analyzing and reporting risk factors. It is suitable for executive briefings, board presentations, and policy proposal materials.
-
Slide Structure
Two-slide set with each slide divided into a left image area (photo space sized for 4:3 aspect ratio) and right text area. Includes one title input field, one descriptive text box (in green or red), and three numeric input fields at the bottom for data entry.


