Social Contribution Diagram – Business Vision and Strategy
RJ0800016_7
- Last Update 08/04/2025
- File Size 6.8MB
- # of Slides 2
- File Format PPTX
- Slide Ratio 16:9
- Color
Keywords
- #Content-Based Slides
- #Design-Based Slides
- #Company Introduction
- #Business Vision and Strategy
- #Diagram
- #Business Areas
- #Business Goals
- #Cluster
- #Closed Cluster Diagram
- #16:9
- #closed-loop diagram PowerPoint
- #4-node circular diagram
- #corporate vision strategy slide
- #business relationship diagram
- #cluster diagram template download
About the Product
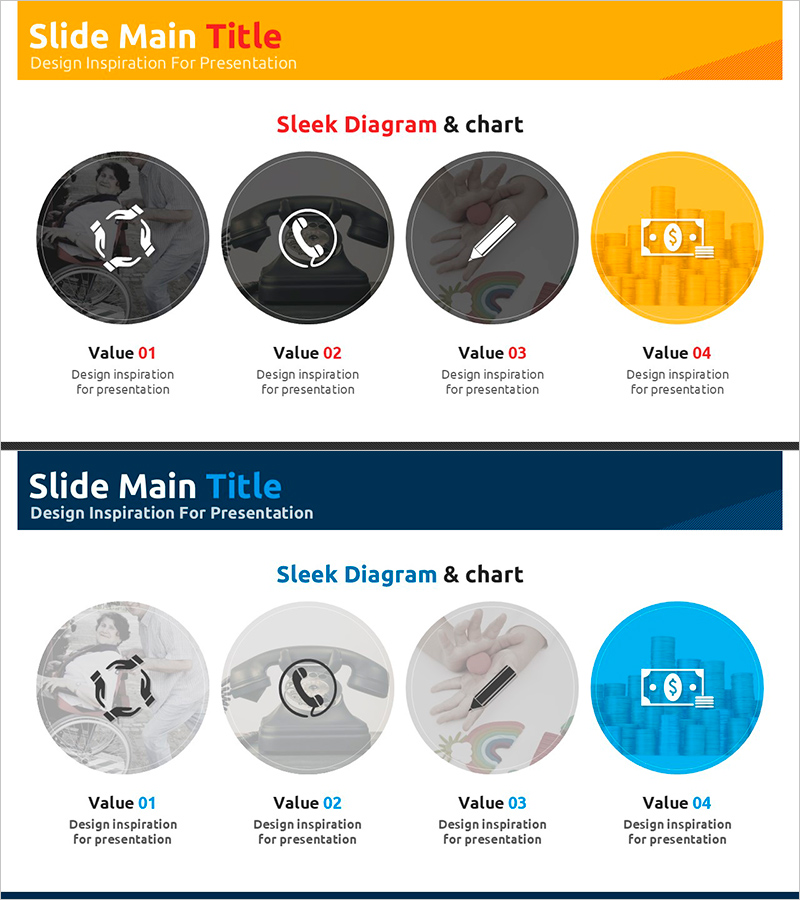
A 4-node closed-loop diagram PowerPoint slide designed to visualize corporate social contribution, vision, and strategy. The structure features a central core concept surrounded by four value items arranged in a circular pattern, effectively expressing mutual relationships and cyclical impact. The design combines gold, gray, and blue color tones with icon-based visualization to convey each element's meaning intuitively. Provided in two slide variations with different background colors (gold and navy) for flexible presentation context adaptation. Available in 16:9 widescreen PPTX format for immediate editing and use.
Usage Points
-
Main Usage
Designed to express mutual relationships and cyclical impact between corporate social contribution values, vision, strategy, and execution items at a glance. The circular arrangement of four value nodes around a central concept effectively visualizes integrated business philosophy and strategic alignment.
-
How to Use
Ideal for corporate vision and strategy presentations, sustainability reports, corporate social responsibility briefings, and executive presentations. Customize each node's text and icons to reflect your organization's core values and strategic priorities. Easily adaptable for different business contexts and stakeholder audiences.
-
Recommended For
Corporate executives, strategic planning teams, sustainability and CSR managers, investor relations professionals, and business development leaders presenting integrated value systems and strategic direction to internal and external stakeholders.
-
Slide Structure
Two-slide set featuring a closed-loop diagram with four nodes arranged in circular pattern around a central element. First slide uses gold background; second uses navy background for flexible theme adaptation. 16:9 widescreen format in editable PPTX.
Related Products
-

Fintech Business Goals Diagram – Implementing Marketing Strategy
#Business Vision and Strategy #Marketing Plan and Strategy #Diagram
-

Business Goals Diagram - Establish Effective Marketing Strategies
#Business Vision and Strategy #Marketing Plan and Strategy #Diagram
-

Medical Service Differentiation Strategy Diagram
#Company Introduction #Product/Service Introduction #Diagram
-

Setting Project Goals Slide - Strengthening Business Strategy
#Business Vision and Strategy #Marketing Plan and Strategy #Diagram
