Infographic Slide for Business Areas and Goals – Creative Approach
RJ0400010_25
- Last Update 05/19/2025
- File Size 0.4MB
- # of Slides 2
- File Format PPTX
- Slide Ratio 16:9
- Color
Keywords
About the Product
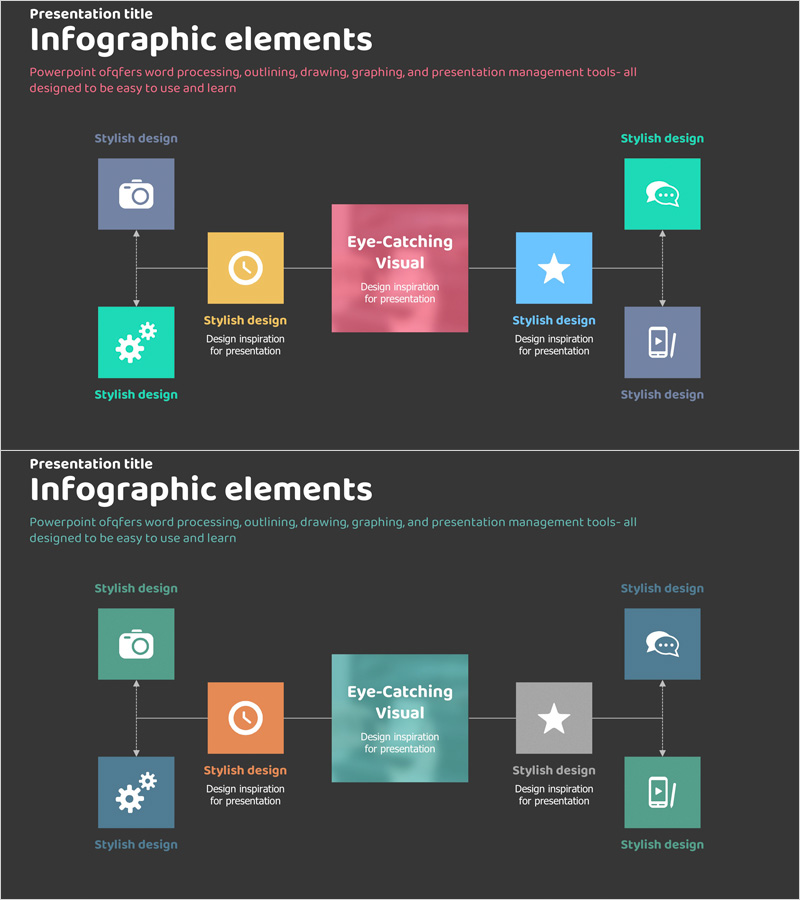
This slide is an infographic visualizing business areas and goals, featuring a diagram designed to convey information clearly. The flow diagram structure is ideal for presenting corporate vision and strategy. The combination of bluegreen and pink colors captures attention and enhances the clarity of communication in collaborative or idea-pitching settings. Visually structured with symbols, this diagram aids in logically presenting content, ensuring greater comprehension of the information. The slide allows for easy replacement of text and images, making it suitable for various business presentations.
Usage Points
-
Main Usage
- This template is ideal for presenting strategic business goals and initiatives during executive meetings, ensuring a clear understanding of the corporate vision among stakeholders.
-
How to Use
- Utilize this slide during project proposals or brainstorming sessions where visual clarity is essential to communicate complex ideas effectively, allowing for easy updates to match the audience's needs.
-
Recommended For
- This template is particularly beneficial for business analysts, project managers, and team leaders who need to present information in a visually appealing manner during internal reviews or strategy sessions.
-
Slide Structure
- The infographic is designed to flow logically, guiding the audience through various business sectors and objectives, making it suitable for structured presentations that require step-by-step explanations.
Related Products
-

Astronomy Field Arrow Shape Diagram
#Business Vision and Strategy #Business Strategy #Diagram
-

Eco-friendly Business Goal Market Strategy Diagram – Sustainable Development
#Business Vision and Strategy #Diagram #Business Strategy
-

Animal Nature Conservation Business Background and Necessity Icon List
#Business Vision and Strategy #Diagram #Business Goals
-

Blood Type Comparison Droplet Shape Diagram
#Company Introduction #Product/Service Introduction #Diagram
