Fast-Food Strategy Presentation Slide – Key Marketing Plan
RJ0800013_20
- Last Update 08/03/2025
- File Size 0.4MB
- # of Slides 2
- File Format PPTX
- Slide Ratio 16:9
- Color
Keywords
- #Content-Based Slides
- #Design-Based Slides
- #Marketing Plan and Strategy
- #Diagram
- #Distribution Strategy
- #Marketing Strategy
- #Cluster
- #Inclusive Cluster Diagram
- #Chain Diagram
- #16:9
- #connected diagram PowerPoint
- #arrow link presentation slide
- #2-node process diagram
- #marketing strategy PPT slide
- #business connection diagram PowerPoint
About the Product
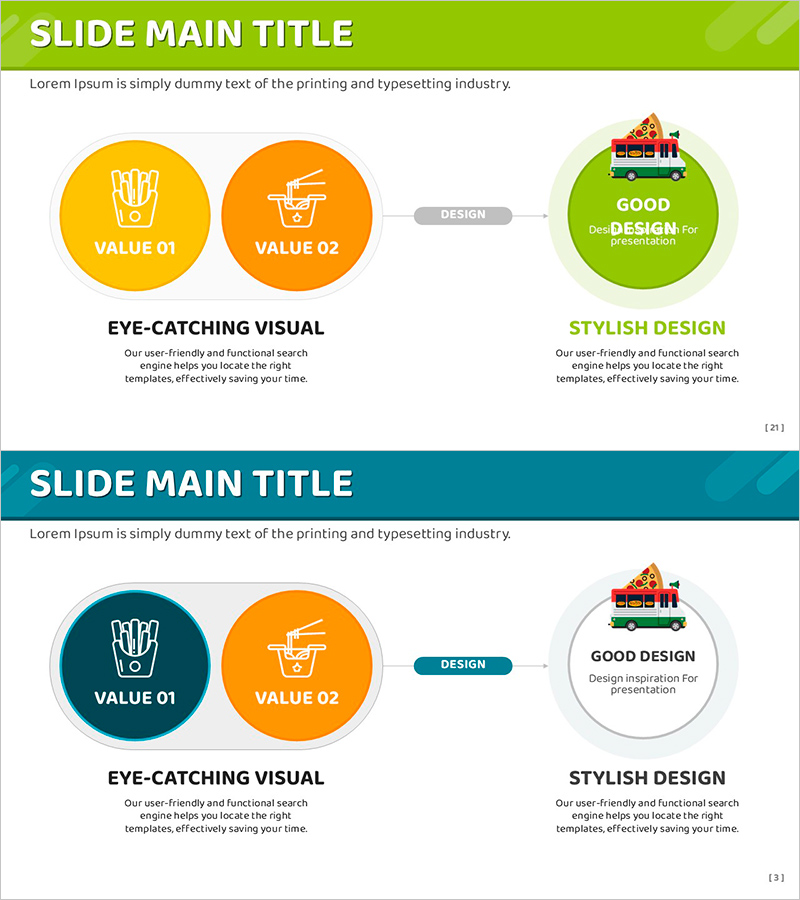
A 2-slide connected diagram PowerPoint presentation template that visually expresses marketing strategy and core values. Two circular nodes in yellow and orange are linked by an arrow to represent VALUE 01 and VALUE 02, with a green circular node on the right emphasizing the final outcome. This structure is ideal for explaining strategic phases, process flows, and cause-and-effect relationships in business presentations. Available in 16:9 widescreen PPTX format for immediate editing, suitable for fast-food, distribution, and marketing planning presentations.
Usage Points
-
Main Usage
Expresses two core marketing strategy values as nodes and connects them to a final outcome. Used for strategy development, proposal presentations, process explanation, and cause-and-effect visualization, particularly effective for marketing plan presentations in fast-food, distribution, and retail industries.
-
How to Use
Replace VALUE 01 and VALUE 02 text and icons with your strategy elements, and modify the right outcome node to your final goal. Arrow and node colors can be adjusted to match corporate brand guidelines, and animation effects can be added according to presentation flow.
-
Recommended For
Marketing managers, planning teams, sales executives, strategy consultants, and business development professionals use this for strategy presentations, proposal explanations, and process visualization. Ideal for marketing planning documents, strategy reports, and executive briefing materials in fast-food, food service, distribution, retail, and food & beverage industries.
-
Slide Structure
2-slide layout with each slide featuring two circular nodes (yellow VALUE 01, orange VALUE 02) connected by a gray arrow, plus a green circular outcome node on the right. Title area at top and descriptive text area at bottom allow for adding titles, subtitles, and detailed explanations.
Related Products
-

Process Chain Diagram Blue Green – Marketing and Distribution Strategies
#Marketing Plan and Strategy #Diagram #Distribution Strategy
-

Expected Effect Inclusion Diagram – Visualizing Strategy and Operations
#Operational Plan #Marketing Plan and Strategy #Diagram
-

Growth Strategy Slide with Subscription Expansion and AI-Driven Roadmap
#Business Vision and Strategy #Marketing Plan and Strategy #Diagram
-

Target Analysis Inclusion Diagram – Insights on Market and Customers
#Market and Competitor Analysis #Marketing Plan and Strategy #Diagram
