Process Chain Diagram Blue Green – Marketing and Distribution Strategies
RJ0600019_20
- Last Update 06/25/2025
- File Size 0.4MB
- # of Slides 2
- File Format PPTX
- Slide Ratio 16:9
- Color
Keywords
- #Content-Based Slides
- #Design-Based Slides
- #Marketing Plan and Strategy
- #Diagram
- #Distribution Strategy
- #Marketing Strategy
- #Cluster
- #Chain Diagram
- #16:9
- #circular process diagram PowerPoint
- #3-step process slide
- #marketing strategy presentation
- #process flow diagram
- #PowerPoint diagram slide template
About the Product
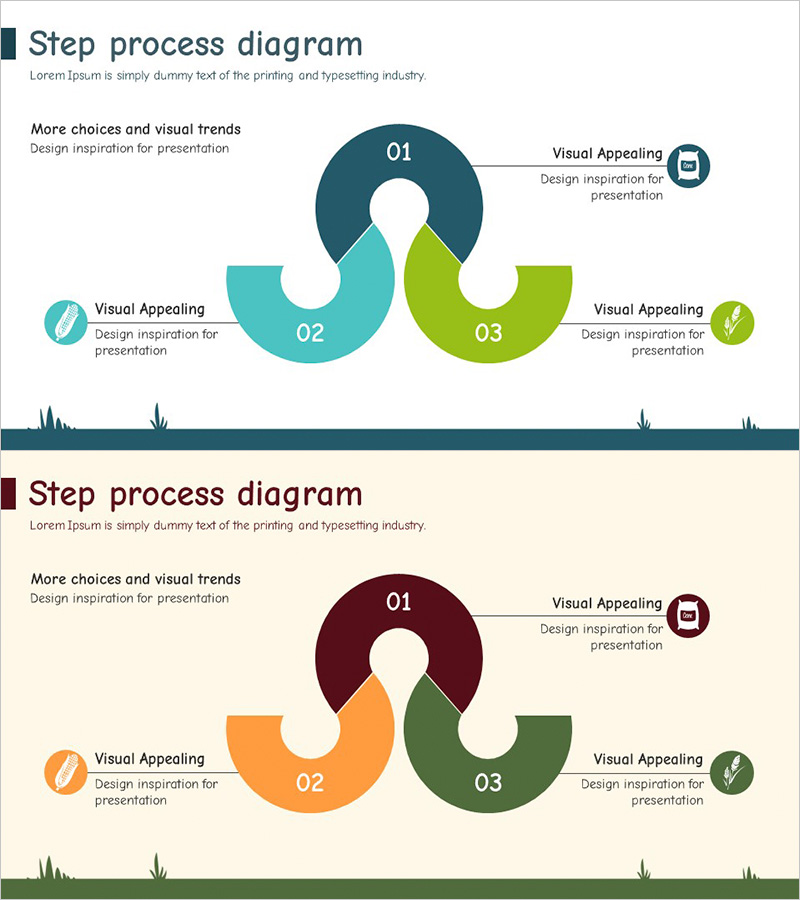
A 3-step circular process diagram PowerPoint slide that visualizes the cyclical relationship between marketing strategy and distribution strategy. Each step is distinguished by three distinct colors—dark blue, turquoise, and lime green—with a white connecting node at the center emphasizing the interaction between stages. Each step includes an icon and descriptive text area, making it ideal for presenting sequential processes such as marketing planning, strategy development, and execution phases. The 2-slide set features different color combinations, suitable for both digital presentations and printed materials.
Usage Points
-
Main Usage
Optimized for visualizing 3-step cyclical relationships in marketing strategy, distribution strategy, and business processes. Emphasizes stage interaction and continuity to enhance audience comprehension, delivering clear logical flow in strategy presentations and execution planning.
-
How to Use
Input specific content such as marketing activities, distribution channels, and customer touchpoints into each step's text area. Icons can be customized to represent each stage's characteristics, and colors are adjustable to match corporate branding. Choose the color combination that best suits your presentation context from the two provided versions.
-
Recommended For
Ideal for marketing professionals, strategy planning teams, sales managers, and business development specialists presenting in strategy meetings, executive briefings, and client proposals. Particularly effective for explaining cyclical processes or iterative improvement structures.
-
Slide Structure
Three curved segments arranged in a circle around a central white connecting node. Each segment displays a step number (01, 02, 03) with an accompanying icon, title, and descriptive text area. Decorative graphic elements at the bottom provide visual balance and stability.
Related Products
-

Fast-Food Strategy Presentation Slide – Key Marketing Plan
#Marketing Plan and Strategy #Diagram #Distribution Strategy
-

Corporate Strategy Diagram Leading the Future – Visualizing Business Flow
#Business Vision and Strategy #Marketing Plan and Strategy #Diagram
-

Business Promotion Strategy Diagram – Effective Marketing Plan
#Business Vision and Strategy #Marketing Plan and Strategy #Diagram
-

7P Marketing Plan to Expand Market Share
#Marketing Plan and Strategy #Diagram #Promotion Strategy
