Expected Effect Inclusion Diagram – Visualizing Strategy and Operations
RJ0400011_28
- Last Update 05/20/2025
- File Size 0.4MB
- # of Slides 2
- File Format PPTX
- Slide Ratio 16:9
- Color
Keywords
- #Content-Based Slides
- #Design-Based Slides
- #Operational Plan
- #Marketing Plan and Strategy
- #Diagram
- #Business Support Plan
- #Distribution Strategy
- #Cluster
- #Inclusive Cluster Diagram
- #Chain Diagram
- #16:9
- #inclusion diagram PowerPoint
- #strategy operations connection slide
- #expected outcome visualization
- #cause-and-effect diagram PowerPoint
- #how to create diagram in PowerPoint
About the Product
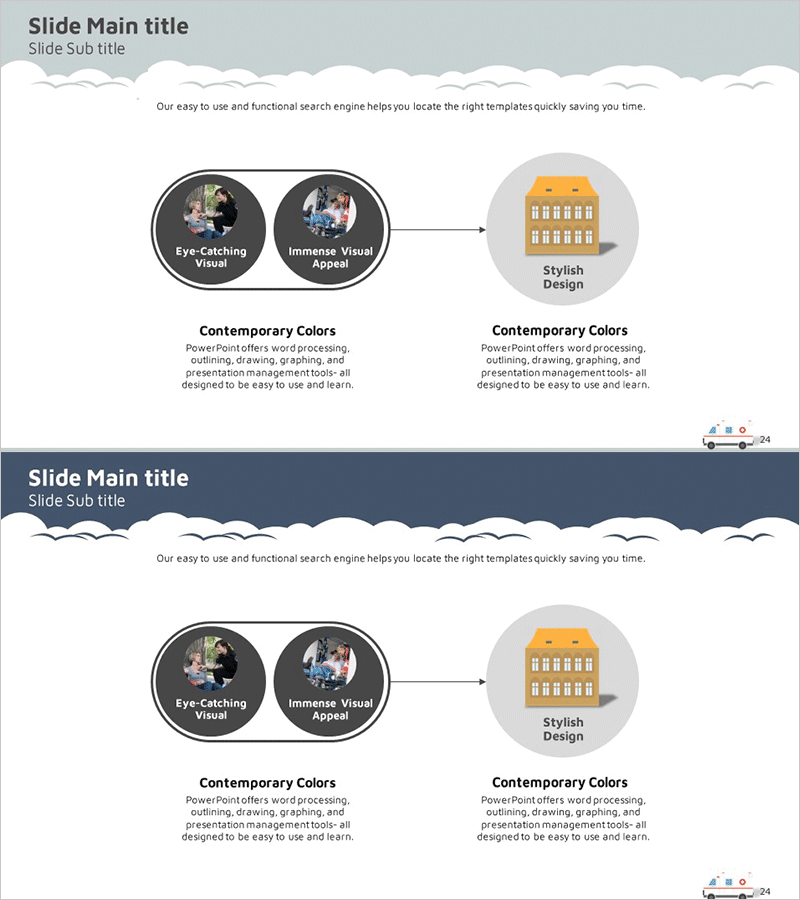
A visually compelling inclusion diagram PowerPoint slide that connects expected outcomes with strategy and operations planning. The design features two circular nodes on the left (representing key effect elements) flowing into a single circular node on the right (representing the final result) via connecting arrows, clearly illustrating cause-and-effect relationships and strategic execution flow. The contemporary color palette combines gray, black, and orange tones, making it ideal for business presentations. Two slide versions are provided: one with a light background and one with a dark navy background. This PowerPoint diagram slide is ready to use for marketing strategy presentations, operational planning, and business objective achievement processes.
Usage Points
-
Main Usage
Visualizes the connection between expected outcomes and execution methods during strategy and operations planning phases. The arrow-based flow from left input elements to right final results helps audiences intuitively understand the logical progression and strategic causality of your business plan.
-
How to Use
Enter expected outcome elements (e.g., customer satisfaction, market share) in the two left circular nodes and the final goal (e.g., revenue growth) in the right circular node. Use the connecting arrows to represent step-by-step strategic execution flow, and add detailed descriptions in the text areas to complete the slide.
-
Recommended For
Recommended for marketing managers, strategic planning teams, and executives preparing business reports. Highly effective for business plans, marketing strategy presentations, operational strategy briefings, and investor pitch decks when explaining goal achievement processes.
-
Slide Structure
Two-slide set: one with light gray background and one with dark navy background. Each slide features two circular nodes on the left (black background with photo areas), center connecting arrows, one circular node on the right (orange background with building icon), and descriptive text area at the bottom.
Related Products
-

Medical Business Support Plan Diagram - Innovative Approach
#Operational Plan #Diagram #Business Support Plan
-

Fast-Food Strategy Presentation Slide – Key Marketing Plan
#Marketing Plan and Strategy #Diagram #Distribution Strategy
-

Therapeutic Efficacy of Water-Soluble Formulations – Diagram Connecting Results
#Product/Service Introduction #Operational Plan #Diagram
-

Visualizing Key Automotive Strategy – Cluster and Connection
#Product/Service Introduction #Operational Plan #Diagram
