Blue Green Donut Chart Analysis – The Allure of Data Visualization
RJ0800011_6
- Last Update 08/03/2025
- File Size 0.3MB
- # of Slides 2
- File Format PPTX
- Slide Ratio 16:9
- Color
Keywords
About the Product
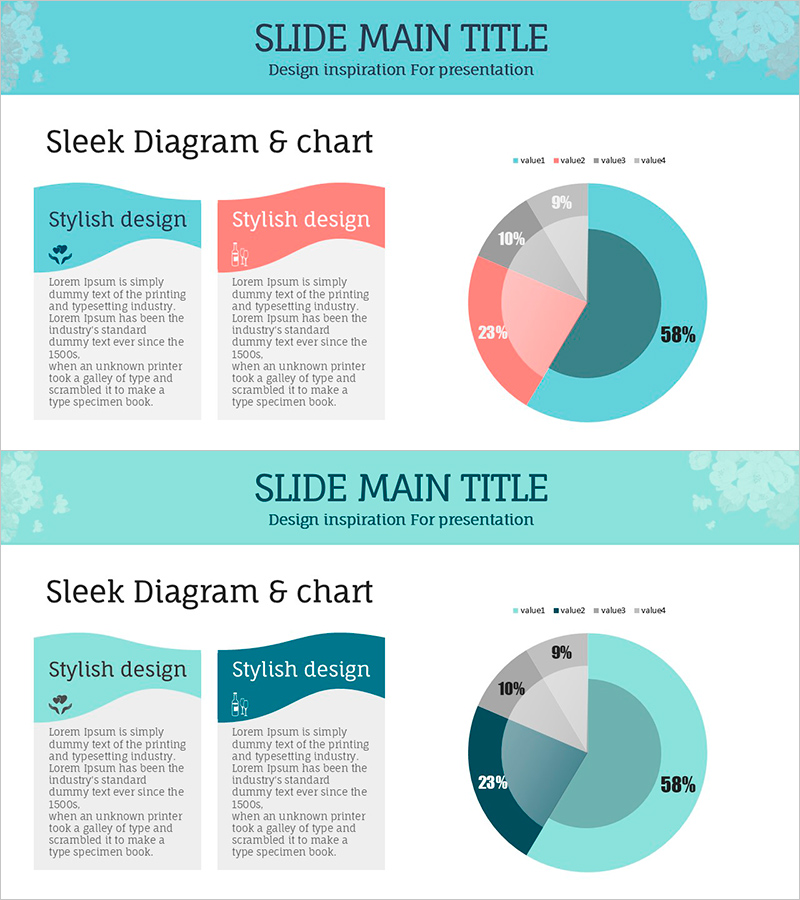
This PowerPoint slide deck features two donut chart layouts in teal and coral color schemes, each visualizing four data segments with proportional representation. The balanced design combines a left-side text box area for descriptions with a right-side chart area for visual impact. Perfect for business presentations, market analysis, budget allocation, and performance reports where ratio-based data needs clear visualization. The 16:9 widescreen format includes 2 fully editable slides with customizable colors, percentages, and labels for immediate use in your presentation.
Usage Points
-
Main Usage
The primary purpose is to display quantitative data proportions in an intuitive, visually compelling format. Donut charts excel at showing how individual components contribute to a whole, making them ideal for market share analysis, budget breakdowns, customer segmentation, and performance metrics.
-
How to Use
Enter your category names and descriptions in the left text boxes, then update the donut chart percentages and colors to match your data. You can duplicate the slides to compare multiple datasets side-by-side or use them sequentially throughout your presentation. The 16:9 aspect ratio ensures optimal display on modern widescreen monitors and projectors.
-
Recommended For
Executive summaries, business analysis presentations, marketing strategy meetings, financial performance reviews, customer satisfaction surveys, and data-driven decision-making sessions. Particularly effective for B2B presentations, consulting reports, academic research presentations, and quarterly business reviews.
-
Slide Structure
Two-slide set with consistent layout: left side contains two text boxes (title and description area), right side features a 4-segment donut chart. Top slide emphasizes teal coloring; bottom slide uses mixed teal and coral palette for visual variety. All elements are built with standard PowerPoint shapes, allowing full customization of colors, percentages, and text.
Related Products
-

Company Overview and Growth Potential Analysis – Utilizing Diagrams and Graphs
#Company Introduction #Business Introduction #Business Vision and Strategy
-

Idea Presentation Template Wide – Market Analysis and Visualization
#Market and Competitor Analysis #Graph #Other
-

Origami Presentation Template – Market Insights and Vision Map Analysis
#Market and Competitor Analysis #Graph #Other
-

Variation Graph for the Line Chart – Optimized Design for Market and Competitor Analysis
#Market and Competitor Analysis #Graph #Competitor Analysis
