Donut Chart Slide for Honeymoon Planning – Visualizing Travel Plans
RJ0800009_24
- Last Update 08/02/2025
- File Size 1.6MB
- # of Slides 2
- File Format PPTX
- Slide Ratio 16:9
- Color
Keywords
- #Content-Based Slides
- #Design-Based Slides
- #Market and Competitor Analysis
- #Graph
- #Market Share
- #Circles
- #Doughnut Chart
- #16:9
- #donut chart PowerPoint slide
- #pie chart presentation template
- #travel planning visualization
- #ratio comparison slide
- #3-segment donut graph
- #percentage data PowerPoint
- #travel duration chart
About the Product
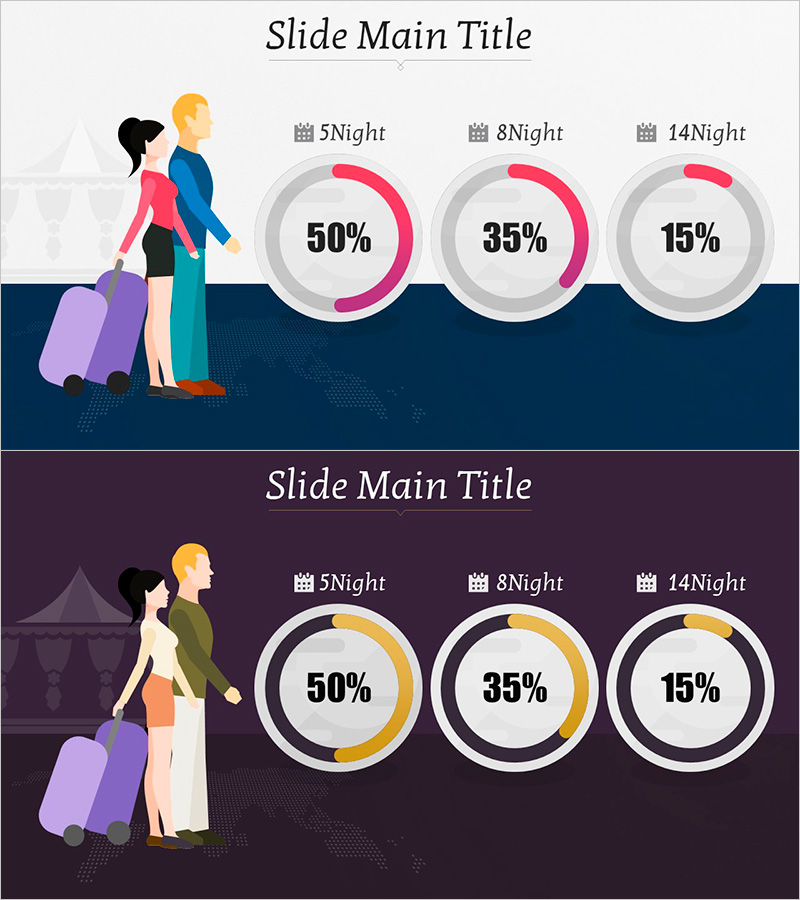
A professional donut chart PowerPoint slide designed to visualize travel planning data with three distinct segments. The slide features a navy background with pink and gold gradient-filled donut charts representing three travel duration options: 5-night (50%), 8-night (35%), and 14-night (15%) packages. The 2-slide set includes an upper layout with traveler illustrations and a lower layout with a dark background for visual variety. Each donut chart clearly separates data segments with distinct color gradients, making ratio comparisons intuitive and engaging. The 16:9 widescreen format ensures compatibility with all modern presentation environments. Ideal for travel agencies, tourism boards, vacation planning presentations, and market share analysis in the hospitality industry.
Usage Points
-
Main Usage
Visualizes ratio-based data across three categories—ideal for travel duration comparison, budget allocation, market share analysis, and percentage breakdowns. The donut format's central space allows for emphasis of key metrics or titles, making it particularly effective for travel industry presentations and vacation planning communications.
-
How to Use
The upper slide combines traveler illustrations with three donut charts in horizontal layout for visual appeal. The lower slide repeats the same structure on a dark background for consistency. Simply replace the percentage values with your own data and customize the gradient colors to match your brand theme. All text and numbers are fully editable.
-
Recommended For
Travel agencies, tourism boards, vacation planners, travel bloggers, tour operators, hospitality marketing teams, and financial analysts presenting ratio-based data. Perfect for anyone needing to communicate percentage distributions in a visually compelling manner.
-
Slide Structure
2-slide layout featuring three donut charts per slide arranged horizontally. Each chart displays a travel duration option with corresponding percentage (5Night 50%, 8Night 35%, 14Night 15%). Upper slide includes traveler illustrations and title; lower slide uses dark navy background. Charts use pink and gold gradient fills with clear percentage labels in the center.
Related Products
-

Equipment Demand Configuration Graph – Effective Visualization for Market Analysis
#Market and Competitor Analysis #Diagram #Graph
-

Travel Destination Infographic Market Share – Intuitive Data Visualization
#Market and Competitor Analysis #Graph #Market Share
-

Donut Chart Visualizing Merchandise Sales Proportion
#Market and Competitor Analysis #Graph #Market Share
-

Donut Chart Slide for Furniture Preferences Survey
#Market and Competitor Analysis #Graph #Market Share
