3 Circles Diagram – Capturing Stylish Design
RJ0800007_16
- Last Update 08/01/2025
- File Size 0.3MB
- # of Slides 2
- File Format PPTX
- Slide Ratio 16:9
- Color
Keywords
About the Product
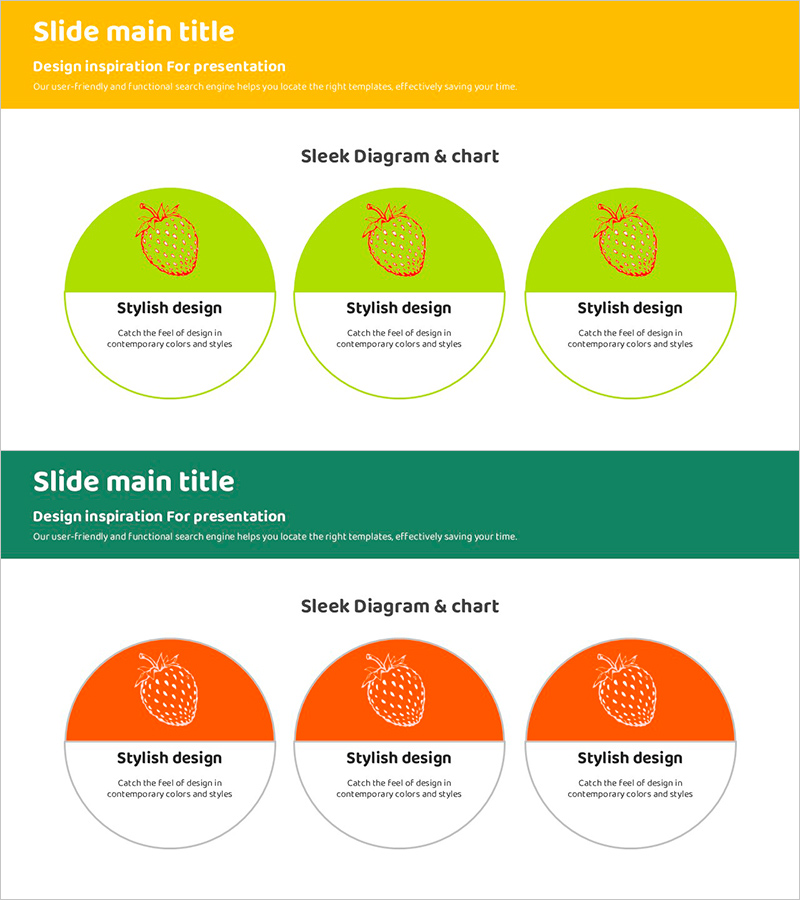
A PowerPoint slide featuring three circular nodes arranged horizontally with a dual-tone color scheme of lime green and orange. Each circle displays a fruit icon at the top for visual emphasis, with title and description text areas positioned below. This diagram slide effectively presents three parallel concepts, product features, or business values in a balanced layout. The 2-slide set is ready to use in presentations and works perfectly for comparison, analysis, and component explanation sections in business decks.
Usage Points
-
Main Usage
Presents three key concepts, product features, or business values in a parallel structure. The icons above each circle provide visual category distinction, while the text areas below enable detailed explanations, enhancing audience comprehension.
-
How to Use
Apply to company profile presentations (three core values), product introduction decks (three main features), marketing plans (three target segments), or business plans (three business areas). Simply edit the text in each circle to match your presentation context.
-
Recommended For
Marketing professionals, business planners, and sales presenters who need to compare or explain three elements. The green-orange color scheme is particularly suitable for food, health, environmental, and energy industry presentations.
-
Slide Structure
2-slide set with three circular nodes arranged horizontally on each slide. Each circle contains a fruit icon (strawberry, pineapple, etc.) at the top, with title text (Stylish design) and description area below. First slide features lime green background; second slide uses orange background for color variation.
Related Products
-

PowerPoint Template for Service Operation Strategy Presentation
#Business Management #Operational Plan #Technical Approach
-

The Road Presentation Table – Sales and Performance Management
#Financial Plans and Performance #Diagram #Sales and Revenue
-

List of Partners – Trust in Business
#Company Introduction #Diagram #Customers and Partners
-

Water and Plant Correlation Chart – Data Visualization
#Product/Service Introduction #Diagram #Graph
