Green Circular Keyword Diagram – Capturing Business Insights
RJ0800007_10
- Last Update 08/01/2025
- File Size 2.1MB
- # of Slides 2
- File Format PPTX
- Slide Ratio 16:9
- Color
Keywords
About the Product
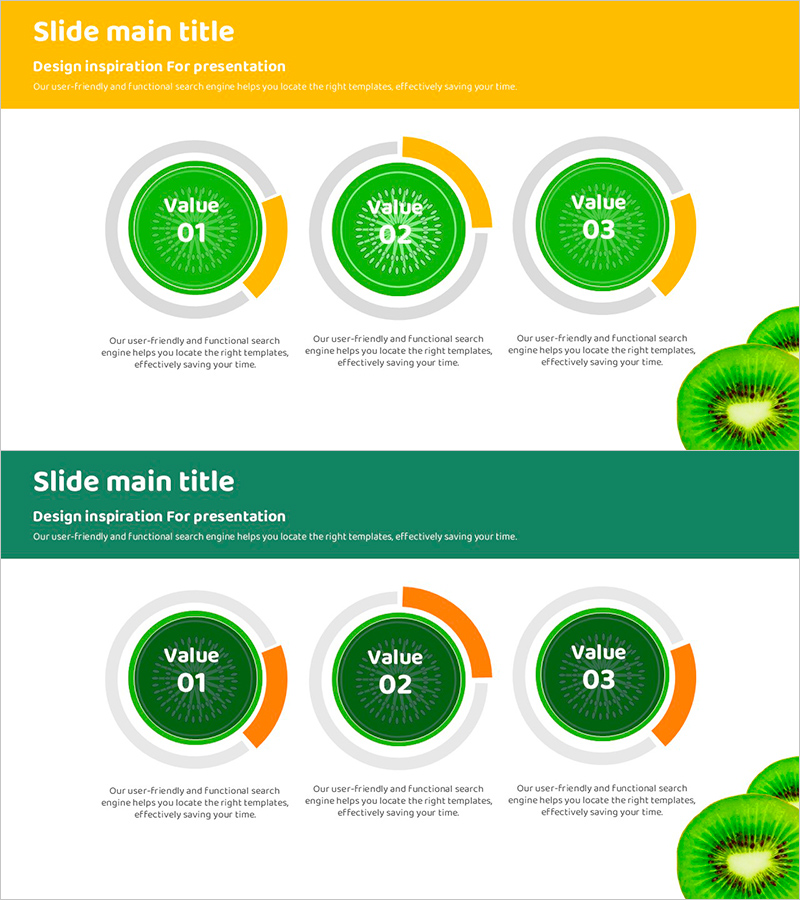
A radial circular diagram PowerPoint slide that clearly communicates business insights and strategic values. The design features a green central circle combined with gray and yellow outer layers, enabling simultaneous representation of three core values. Each circular node provides an independent text input area with supporting description space below. The 2-slide set is optimized for 16:9 widescreen format and ready for immediate use in various presentation contexts. Perfect for emphasizing company strategy, product features, organizational values, or any scenario requiring three-element comparison and visual hierarchy.
Usage Points
-
Main Usage
Optimized for presenting and comparing three core values, strategies, or characteristics simultaneously. Each circular node functions independently while remaining integrated within the central structure, effectively conveying individual element importance within the broader context.
-
How to Use
Replace 'Value 01·02·03' text with your specific items and add detailed content in the description areas below each node. Maintain the default green-gray-yellow color scheme or customize with your brand colors. Reuse or duplicate the 2-slide set to represent additional items as needed.
-
Recommended For
Executive reports, company vision-mission-values presentations, product feature highlights, organizational strategy announcements, marketing differentiation points, and investor pitch decks requiring three-element value communication across management, marketing, product, and business development roles.
-
Slide Structure
Each slide features a title area with yellow background at the top and a content area below. The content area displays three radial circular nodes arranged horizontally, each consisting of a green central circle (text input area) surrounded by gray and yellow outer layers. Description text fields below each node allow for detailed information addition.
Related Products
-

Marketing Strategy Arrow Diagram – Illustrating Business Flow
#Business Vision and Strategy #Marketing Plan and Strategy #Diagram
-

Communication and Learning Diagrams - Effective Marketing Plans and Product Introductions
#Product/Service Introduction #Marketing Plan and Strategy #Diagram
-

Company Location Guide Slide – Ideal for Modern Diagram
#Company Introduction #Diagram #Company Overview
-

Key Partner Checklist – Effective Collaboration Diagram
#Company Introduction #Diagram #Customers and Partners
