Yellow Point Table Slide – Harmony of Format and Precision
RJ0800003_8
- Last Update 07/31/2025
- File Size 0.5MB
- # of Slides 2
- File Format PPTX
- Slide Ratio 16:9
- Color
Keywords
About the Product
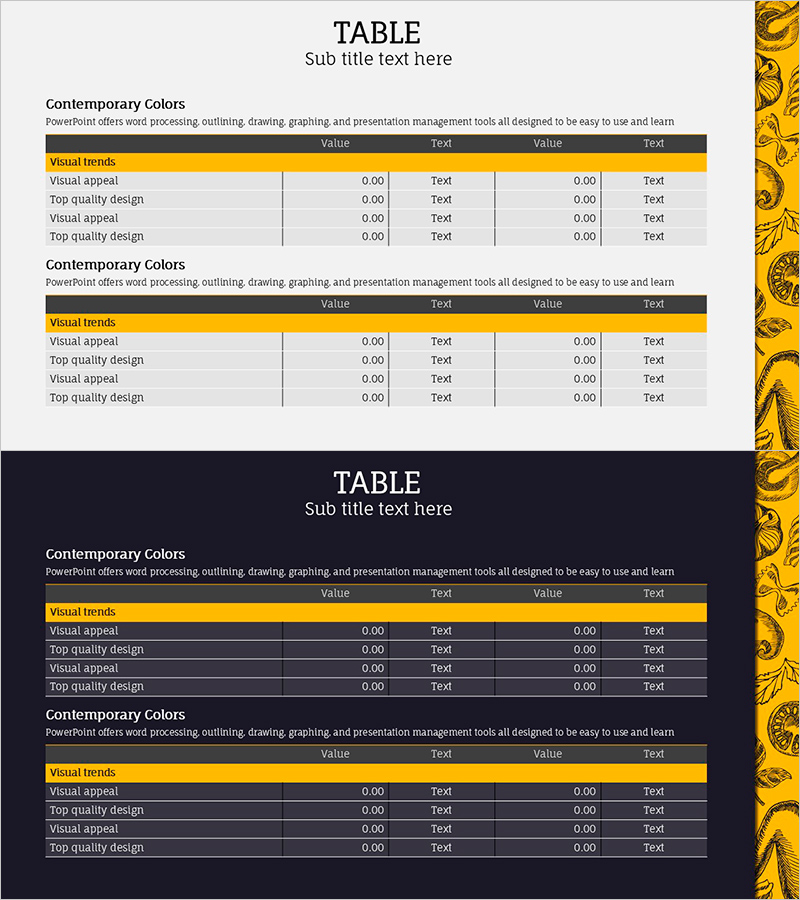
A professional 4-row data table PowerPoint slide designed for clear business information presentation. Features a yellow header row and dark gray background that create strong visual contrast, with a left label column and right data area layout. Rows alternate between white and light gray backgrounds to enhance readability and information hierarchy. Ideal for expressing numerical data, text items, and comparative analysis. This slide template is ready to use in presentations, reports, and business documents without additional formatting.
Usage Points
-
Main Usage
Present quantitative data such as financial status, sales performance, cost analysis, and KPIs in clear table format. The yellow header emphasizes key items, while row-by-row color differentiation maximizes data readability and visual hierarchy.
-
How to Use
Use in financial reports, business plan presentations, proposal cost comparisons, quarterly performance reviews, and executive briefings. Simply input numbers or text into each cell for an instantly professional data presentation.
-
Recommended For
Finance teams, sales departments, operations managers, and executives preparing reports, analysis documents, and performance presentations. Particularly suitable for meetings requiring data-driven decision making and quarterly business reviews.
-
Slide Structure
Two-slide set with light background version (top yellow header + 4-row data area) and dark background version (identical structure). Each version features 2-column (label and data) × 4-row layout containing 8 data cells for flexible information input.
Related Products
-

VR Service Configuration Contents – Structured and Stylish Design
#Product/Service Introduction #Technical Approach #Diagram
-

Watercolor Butterfly Company History – Business Vision and Strategy
#Business Vision and Strategy #Business Strategy #Diagram
-

Technology Service Promotion Plan and Process – Linear Flow Diagram
#Business Management #Operational Plan #Diagram
-

Closed Diagram with Performers – Visual Expression of Musical Harmony
#Diagram
