Green Orange Connection Diffusion Diagram – Creative Visuals
RJ0800002_8
- Last Update 07/31/2025
- File Size 0.1MB
- # of Slides 2
- File Format PPTX
- Slide Ratio 16:9
- Color
Keywords
About the Product
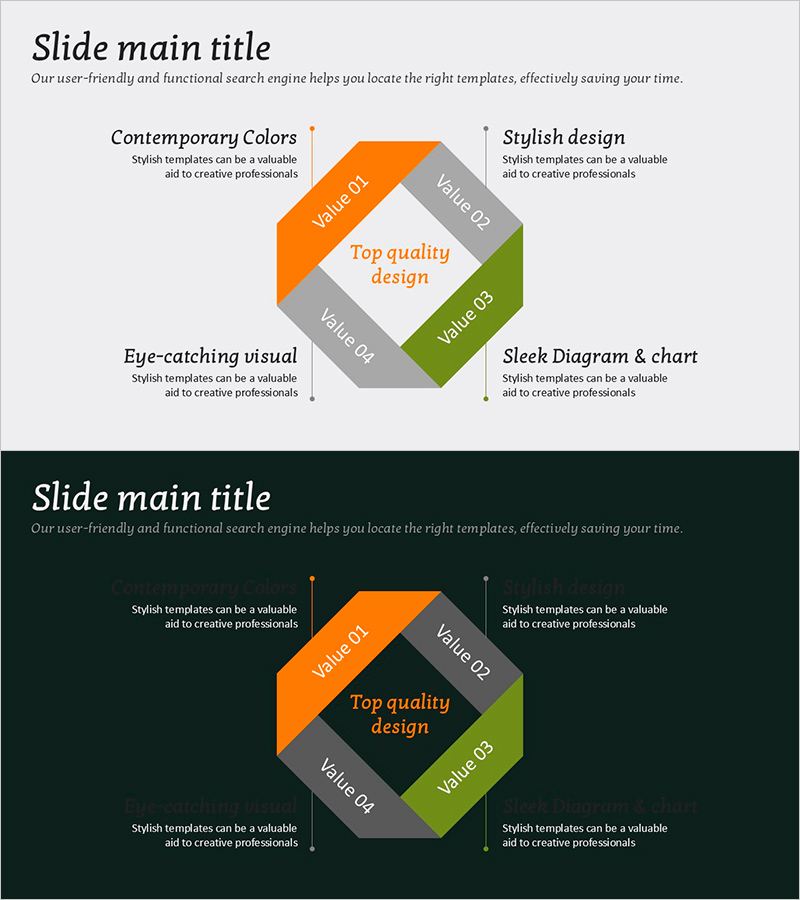
A radial diffusion diagram PowerPoint slide with four directional elements extending from a central concept. Diamond-shaped nodes in orange, green, and gray tones branch outward to represent ideas, strategies, or values radiating from a core message. The 2-slide set includes both light and dark background versions for flexible presentation contexts. Each section is fully editable for text and descriptions, making it ideal for business presentations, strategic planning decks, and proposal documents that require multi-dimensional concept visualization.
Usage Points
-
Main Usage
Effectively visualizes how a central concept branches into four distinct elements—strategies, values, features, or benefits. Ideal for presenting multi-faceted information in a balanced, hierarchical structure that audiences can quickly grasp.
-
How to Use
Enter your core message in the center white area, then populate each of the four diamond shapes with supporting details. Use the light background slide for standard presentations and the dark background for premium, high-impact settings. Colors and fonts are fully customizable.
-
Recommended For
Executive briefings, strategic planning presentations, product launch decks, marketing proposals, organizational restructuring explanations, and business pitches. Commonly used by consultants, finance professionals, IT managers, and marketing teams.
-
Slide Structure
2-slide set featuring a central white message area surrounded by four diamond-shaped nodes in orange, green, and gray. First slide has a light gray background; second features a dark background for visual contrast and emphasis.
Related Products
-

IT Business Detail Plan Diagram – Cluster and Connection
#Product/Service Introduction #Operational Plan #Diagram
-

Retro Vibe Speaker Profile Slide – Embrace Style and Trust
#Company Introduction #Diagram #Introduction of Executives
-

Flow of Chemical Experiment Steps - Linear Process Explanation
#Operational Plan #Diagram #Production and Technology Development Strategy
-

Customer Reviews and Feedback Table – A Powerful Tool for Customer Engagement
#Market and Competitor Analysis #Customer Success Stories #Diagram
