Visualizing Vegetable Intake Survey Results for Males and Females
RJ0800002_10
- Last Update 07/31/2025
- File Size 0.6MB
- # of Slides 2
- File Format PPTX
- Slide Ratio 16:9
- Color
Keywords
About the Product
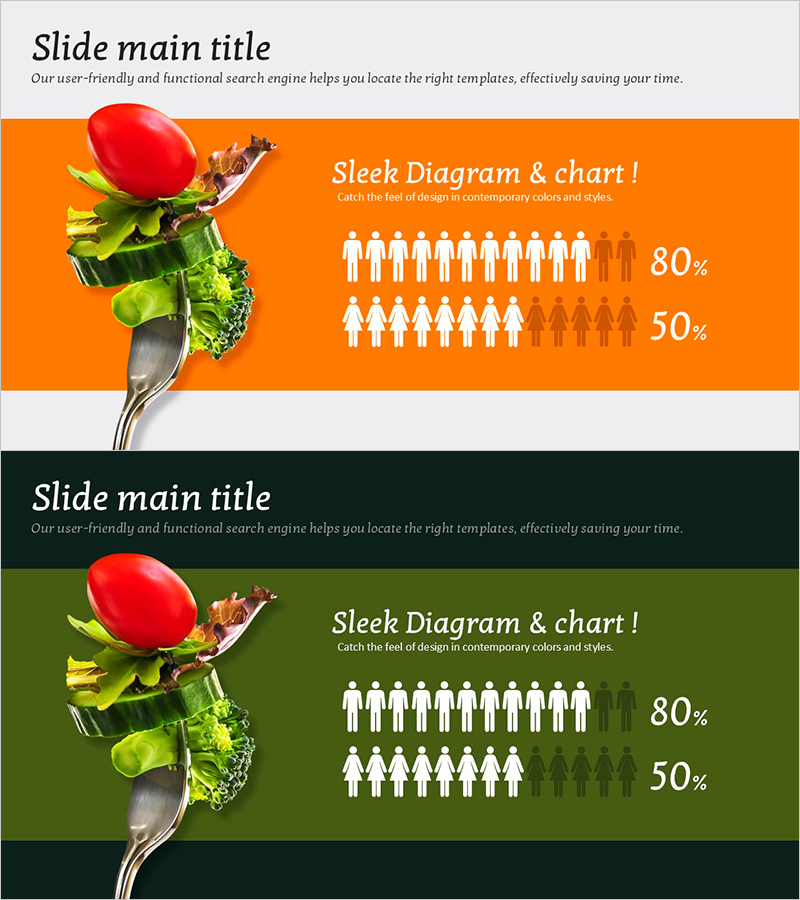
A gender comparison infographic PowerPoint slide designed to visualize male and female demographic data side by side. The slide features an orange section for one gender and a green section for the other, with human icons and percentage values clearly displayed. Ideal for presenting customer analysis, market research, product preference surveys, and statistical comparisons. The 16:9 widescreen PPTX format allows immediate editing and seamless integration into presentations and reports.
Usage Points
-
Main Usage
This infographic slide enables side-by-side comparison of male and female demographic data with visual clarity. Human icons combined with percentage values convey both qualitative and quantitative information simultaneously. Effectively visualizes gender-based analysis results such as product preferences, customer satisfaction, consumption patterns, and market insights.
-
How to Use
Input male data in the orange section and female data in the green section. Adjust the number of human icons and percentage values to match your actual data. Edit the title and subtitle areas to reflect your survey topic and key findings, then incorporate the slide into your presentation deck.
-
Recommended For
Marketing departments presenting customer segmentation analysis, market research reports, product development teams analyzing gender-based preferences, sales presentations highlighting target demographics, and healthcare or consumer goods industry statistical documentation.
-
Slide Structure
The slide contains a gray header area with two text input fields for title and subtitle, an orange section with 10 human icons and one percentage value, a green section with 8 human icons and one percentage value, and a decorative fork with food image on the left side to reinforce the presentation theme.
Related Products
-

A Male-Female Survey of Protein Intake – Gender Analysis
#Market and Competitor Analysis #Graph #Other
-

User Analysis Results Diagram - Infographic for Customer Insights
#Market and Competitor Analysis #Graph #Other
-

Mixed Bar Graph for Market Analysis – Trends and Opportunities
#Market and Competitor Analysis #Graph #Other
-

Human Details Infographic Chart – Customer Analysis and Market Overview
#Market and Competitor Analysis #Graph #Other
