Scientific Structure Radial Graph – A Powerful Tool for Market Analysis
RJ0700027_25
- Last Update 07/30/2025
- File Size 0.4MB
- # of Slides 2
- File Format PPTX
- Slide Ratio 16:9
- Color
Keywords
- #Content-Based Slides
- #Design-Based Slides
- #Market and Competitor Analysis
- #Graph
- #Market Analysis
- #Other
- #Radar Chart Spider Chart
- #16:9
- #radial chart PowerPoint
- #radial graph slide template
- #5-item data visualization
- #market analysis slide
- #competitive analysis PowerPoint
- #how to create radial chart in PowerPoint
About the Product
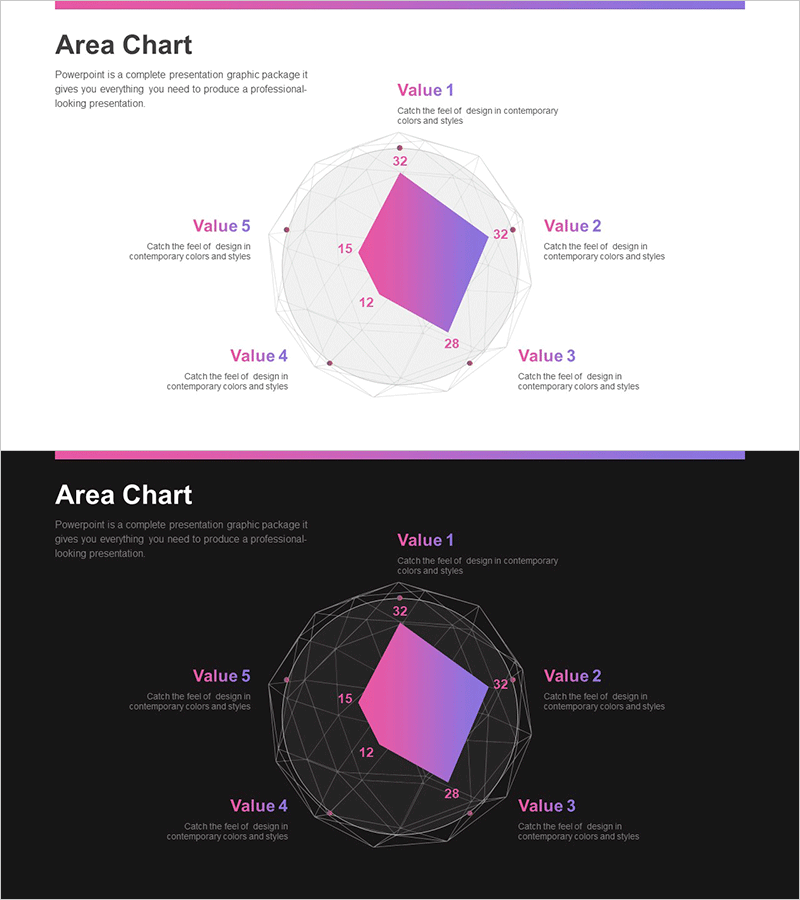
A PowerPoint slide that visualizes five-item data in radial format with a magenta-to-purple gradient fill and circular grid lines for intuitive data comparison. Ideal for market analysis, competitive benchmarking, capability assessment, and multi-dimensional data presentations. Two versions provided: light background for printing and PDF distribution, dark background for projector presentations. Fully editable PPTX file in 16:9 widescreen format, ready to customize with your data and labels.
Usage Points
-
Main Usage
Displays five-dimensional data in radial format for comparative analysis. Each data point is plotted on the circular grid, allowing viewers to see both individual values and overall structure simultaneously. Commonly used for market positioning, competitor strength comparison, organizational capability mapping, and product feature analysis.
-
How to Use
Five value labels (Value 1–5) are positioned around the radial diagram with corresponding text boxes on the right. Enter your data values into the magenta-filled area and add descriptive text for each item in the right-side boxes. Choose the light background version for print and PDF, or the dark background version for live projector presentations.
-
Recommended For
Executive reports, marketing strategy presentations, competitive analysis documents, organizational capability assessments, product positioning analyses, and consulting proposals. Particularly effective for B2B presentations and strategic planning meetings where five or more comparison items need balanced representation.
-
Slide Structure
Central radial diagram with five nodes connected to outer circular grid lines showing five-level scale. Magenta gradient fill emphasizes the data area. Five value labels with description text boxes arranged vertically on the right side. Title area positioned at the top of the slide.
Related Products
-

Green Red Comparative Radiograph – Visual Tool for Market Analysis
#Market and Competitor Analysis #Graph #Market Analysis
-

Green Yellow Radial Chart
#Market and Competitor Analysis #Graph #Market Analysis
-

Online Shopping Mall System Radial Graph – Dynamic Data Visualization
#Business Introduction #Market and Competitor Analysis #Graph
-

Competitor Analysis Pentagon Radial Graph – Concept and Strategy
#Market and Competitor Analysis #Graph #Competitor Analysis
