Unified Value in Overlap – Effective Risk Management
RB0800037_6
- Last Update 03/25/2025
- File Size 4.3MB
- # of Slides 2
- File Format PPTX
- Slide Ratio 4:3
- Color
Keywords
- #Content-Based Slides
- #Design-Based Slides
- #Product/Service Introduction
- #Operational Plan
- #Diagram
- #Features
- #Risk Management
- #Cluster
- #Combination Diagram
- #4:3
- #Venn diagram PowerPoint slide
- #three-circle overlap diagram
- #intersection slide template
- #risk management PPT
- #diagram PowerPoint template download
About the Product
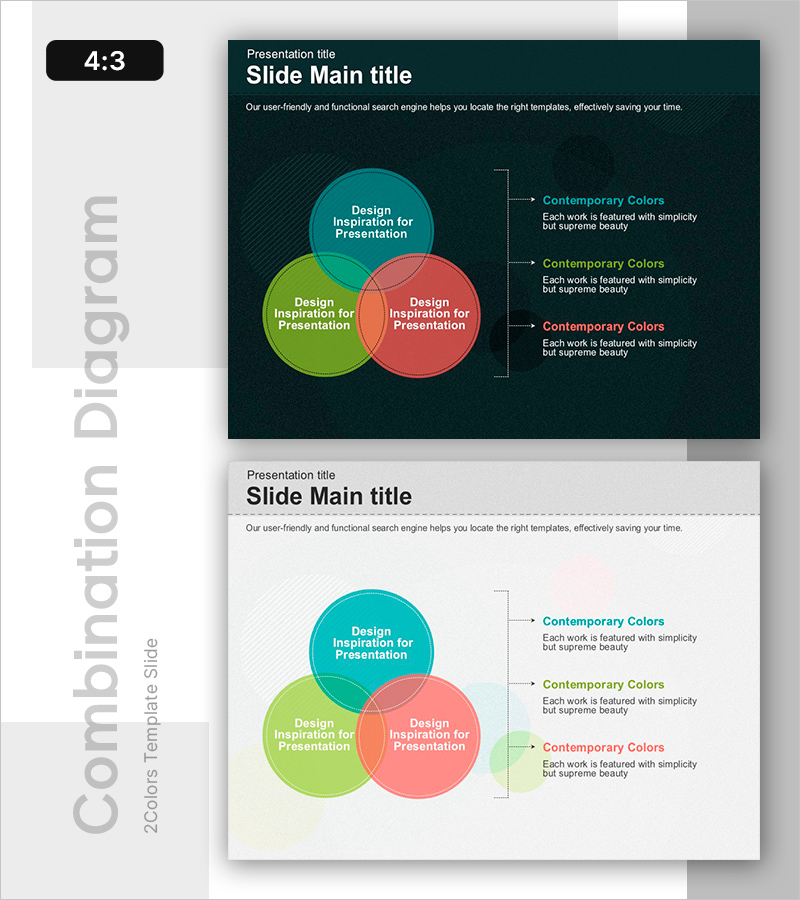
A three-circle Venn diagram PowerPoint slide featuring overlapping circles in turquoise, lime green, and coral red. The intersecting areas clearly represent shared concepts, relationships, and synergies between three distinct elements. White text on a dark navy background ensures high contrast readability, with dotted arrow connectors linking each section to descriptive text on the right. The 2-slide set includes both dark theme (for projection) and light theme (for print and PDF distribution) versions. Ideal for risk management, strategic planning, organizational analysis, and any presentation requiring visualization of complex three-way relationships.
Usage Points
-
Main Usage
Visualizes relationships and intersections between three concepts, departments, or strategies. The overlapping areas highlight shared values, common ground, and synergistic effects. Commonly used for risk management frameworks, organizational structure mapping, business strategy alignment, and marketing positioning analysis.
-
How to Use
Enter concept names, department titles, or strategy labels within each circle. Add detailed explanations next to the arrow connectors on the right side. Colors remain fixed, but all text is fully editable. Use the dark theme version for projector presentations and the light theme for printed materials and digital distribution.
-
Recommended For
Executive presentations, strategic planning sessions, organizational restructuring briefings, risk management reports, marketing strategy workshops, consulting proposals, academic presentations, and educational seminars. Particularly effective when explaining complex systems with three or more interacting variables.
-
Slide Structure
2-slide set. Top slide features a dark navy background with three overlapping circles (turquoise, lime, coral) centered on the slide, with three dotted arrow connectors linking to explanatory text on the right. Bottom slide mirrors the structure with a light background and identical circle placement and text layout. 4:3 aspect ratio, PPTX format.
Related Products
-

Furniture Company Core Competency Diagram
#Product/Service Introduction #Business Vision and Strategy #Diagram
-

Research Project Progress Overlap Diagram
#Product/Service Introduction #Business Strategy #Diagram
-

Presentation Template for Business Operations with Nesting Diagram
#Operational Plan #Diagram #Risk Management
-

How to Deal with a Crisis in Case of an Accident - Effective Risk Management Tool
#Operational Plan #Risk Management and Regulatory Compliance #Diagram
