AI Business Area Diagram – AI and Technology Trends
RJ0700025_4
- Last Update 07/29/2025
- File Size 1.3MB
- # of Slides 2
- File Format PPTX
- Slide Ratio 16:9
- Color
Keywords
- #Content-Based Slides
- #Design-Based Slides
- #Company Introduction
- #Product/Service Introduction
- #Diagram
- #Business Areas
- #Program Introduction
- #Cluster
- #Closed Cluster Diagram
- #16:9
- #hexagon text box PowerPoint
- #AI diagram slide template
- #4-item emphasis slide
- #technology trends presentation
- #business area diagram PowerPoint
About the Product
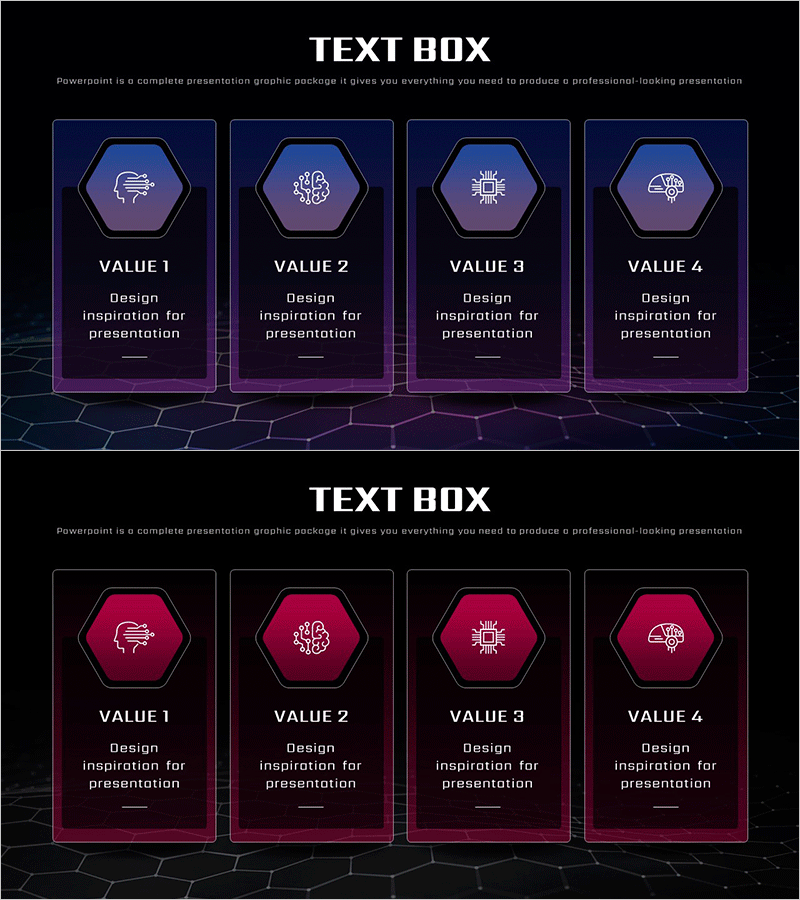
A PowerPoint slide that visualizes AI and technology trends through four hexagon-shaped text boxes with embedded icons. Available in two color versions—dark navy and hot pink—this 16:9 widescreen slide deck features 2 slides designed to highlight core business values and technology domains. Each hexagon contains an icon and descriptive text, making it ideal for presentations on AI applications, business strategies, and technology trends. Ready-to-use presentation material that can be customized for immediate deployment in corporate settings.
Usage Points
-
Main Usage
This slide emphasizes four core business areas or technology domains using hexagon-shaped containers with icons and text. The visual layout creates strong impact and directs audience attention to key points. Suitable for technology trend presentations, business strategy explanations, product feature overviews, and corporate communications.
-
How to Use
Edit the text and icons in each hexagon to match your content. Use the dark navy version for technology and IT sector presentations, and the hot pink version for presentations emphasizing creativity and innovation. Customize background colors and text styling to align with your corporate brand guidelines.
-
Recommended For
Recommended for IT and technology company business briefings, AI solution provider product launches, startup investment pitch decks, technology conference presentations, and corporate training seminars. Particularly effective when explaining core values or key concepts organized into four distinct categories.
-
Slide Structure
Two-slide deck with four hexagon text boxes arranged horizontally on each slide. Each hexagon contains an icon at the top, label text in the middle, and descriptive text at the bottom. Dark navy background with light text and hot pink background with white text create clear visual contrast and readability.
Related Products
-

List of Business Projects – Information Delivery and Visualization
#Company Introduction #Product/Service Introduction #Diagram
-

Eco Friendly Checkerboard Diagram – Harmony of Business and Environment
#Company Introduction #Product/Service Introduction #Diagram
-

Introduction to Gaming Device Types Slide - Visual Appeal and Contemporary Colors
#Company Introduction #Product/Service Introduction #Diagram
-

Online Shopping Mall Service Program Slide – Customer-Centric Innovation
#Company Introduction #Product/Service Introduction #Diagram
