Aerospace Industry Business Vision Diagram
RJ0700020_7
- Last Update 07/28/2025
- File Size 1.2MB
- # of Slides 2
- File Format PPTX
- Slide Ratio 16:9
- Color
Keywords
About the Product
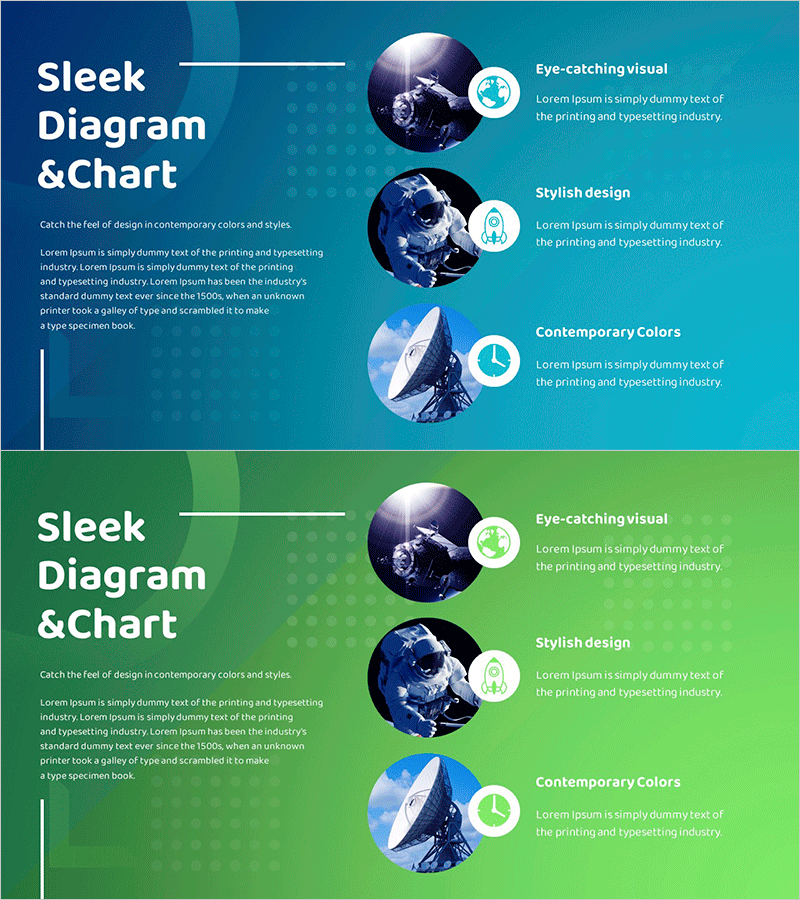
A radial cluster diagram PowerPoint slide designed to visualize aerospace industry business vision and strategy. The layout features a central core concept radiating outward to three key elements (Eye-catching visual, Stylish design, Contemporary Colors), each represented by circular image nodes with accompanying text descriptions. The design employs a teal-to-blue gradient background with white connector lines and circular icons, creating a contemporary information hierarchy. The 2-slide set provides identical layouts in contrasting color schemes (teal and green) for flexible presentation contexts. Delivered in 16:9 widescreen PPTX format, fully editable and ready for immediate use.
Usage Points
-
Main Usage
Visualizes corporate vision, strategy, and core values by radiating from a central concept to surrounding supporting elements. Particularly effective for complex business structures in aerospace, technology, and manufacturing sectors, clearly communicating relationships between a primary message and 3-5 supporting concepts.
-
How to Use
Deploy in the vision and strategy section of presentations to introduce corporate core values and execution strategies. Customize each node's text and imagery to represent product features, service domains, organizational functions, or market segments. Toggle between teal and green color schemes to adjust presentation tone and visual emphasis.
-
Recommended For
Executive presentations in aerospace, technology, manufacturing, and energy sectors; investment pitch decks; business plan vision sections; strategy consulting reports; and new business introduction presentations. Recommended for B2B contexts requiring clear, intuitive explanation of complex multi-faceted concepts.
-
Slide Structure
2-slide set with consistent layout structure. Each slide features a left-aligned title area (Sleek Diagram & Chart) and right-aligned radial node arrangement. One central circular image node radiates to three satellite nodes (circular icons plus descriptive text) in a hierarchical cluster pattern. Background gradient (teal-to-blue or green-to-lime) with white connector lines creates visual depth and information flow.
Related Products
-

Business Vision and Goals Slide – Cluster Diagram
#Business Vision and Strategy #Diagram #Business Vision
-

Visually Representing Four Core Values in a PowerPoint Slide
#Company Introduction #Business Vision and Strategy #Operational Plan
-

Linkage Structure by Health Goals – Vision and Strategy
#Business Vision and Strategy #Diagram #Business Vision
-

Shells and Starfish Diagrams – Visualizing Your Business Strategies
#Business Vision and Strategy #Diagram #Business Vision
