AI Business History Diagram – Journey of AI Business
RJ0700017_8
- Last Update 07/27/2025
- File Size 0.5MB
- # of Slides 2
- File Format PPTX
- Slide Ratio 16:9
- Color
Keywords
About the Product
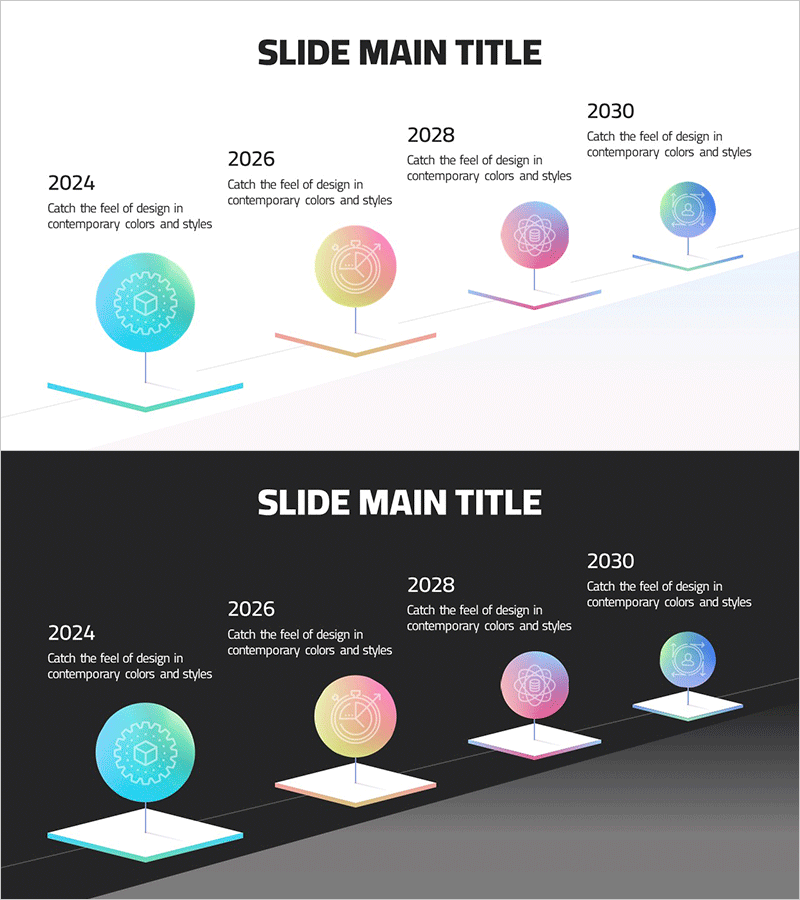
A cluster diagram PowerPoint slide that visualizes business milestones and AI business journey across time. Four milestone nodes are connected to a central timeline, each featuring gradient-filled circular nodes in cyan, yellow, pink, and purple with embedded icons. Connection lines establish hierarchical relationships and temporal flow simultaneously. The slide set includes two versions: a light background for standard presentations and a dark background for premium settings. Ideal for company overview presentations, technology roadmap sections, and investor pitch decks requiring clear milestone visualization.
Usage Points
-
Main Usage
Designed to communicate corporate business history, technology development stages, and AI business evolution through visual hierarchy. The cluster structure clearly conveys milestone relationships and temporal progression, making it ideal for company overview presentations where storytelling about growth and innovation is essential.
-
How to Use
Replace placeholder text in each node with year and milestone description. Swap default icons with industry-specific icons matching your business domain. Use the light background slide for standard corporate presentations and the dark background slide for premium or evening events. Adjust node colors and line thickness to emphasize priority or sequence.
-
Recommended For
Executive presentations to investors, startup technology roadmap explanations, IT and AI company business evolution narratives, annual business performance reports, corporate branding materials, recruitment presentation decks, and venture capital pitch meetings requiring clear milestone communication.
-
Slide Structure
Four-node cluster configuration with one central or left-positioned node connected to three surrounding nodes (right, top, bottom). Each node features a gradient-filled circle containing an icon and text area. Connection lines use arrows or straight lines to indicate relationships. Two-slide set provides light background version (light gray, white) and dark background version (charcoal, black) for flexible presentation contexts.
Related Products
-

Grid Layout History Slides – Effective Timeline Visualization
#Company Introduction #Diagram #History
-

Modern Theme History Slides – Visualizing Your Journey
#Company Introduction #Product/Service Introduction #Diagram
-

Yearly Plan Arrow Diagram – Quality Assurance Plans
#Company Introduction #Business Management #Diagram
-

History of Barista Template – Engaging Business Story
#Company Introduction #Diagram #History
