Market and Competitor Analysis Area Graph – Effective Visualization for Comparison
RJ0700016_27
- Last Update 07/26/2025
- File Size 0.4MB
- # of Slides 2
- File Format PPTX
- Slide Ratio 16:9
- Color
Keywords
About the Product
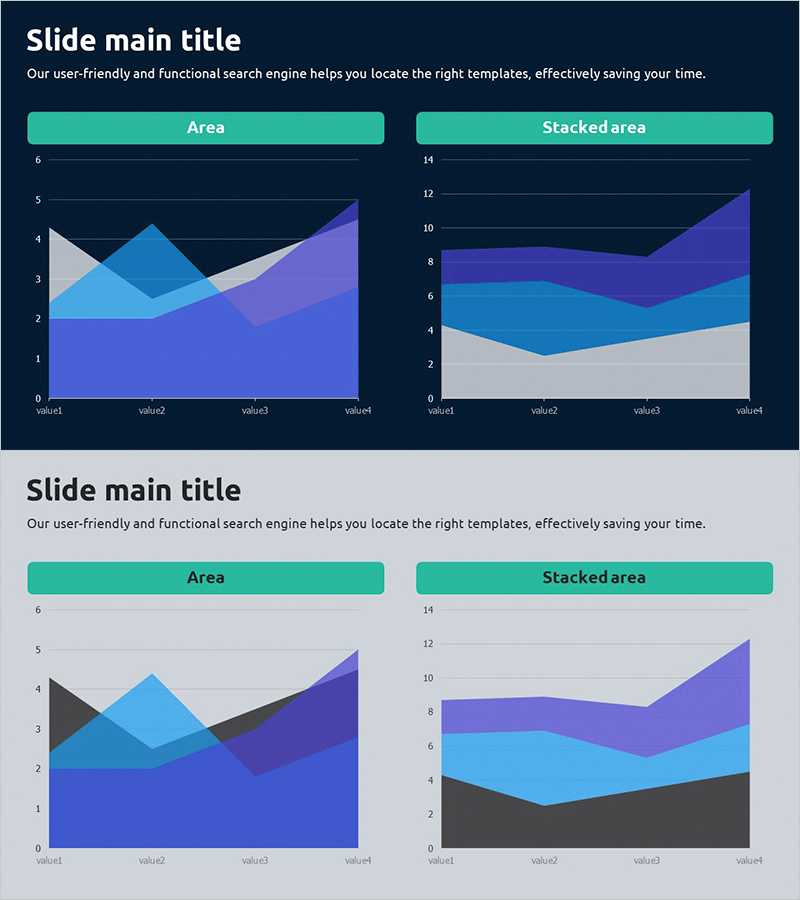
A professional PowerPoint slide featuring area charts for market and competitor analysis. This presentation template includes two distinct slide designs: a dark navy background version and a light gray background version, each displaying two complementary chart types side by side. The left chart shows a standard area graph, while the right displays a stacked area chart, enabling effective data comparison and trend visualization. Multi-layered colors in turquoise, blue, and purple gradients clearly differentiate data layers across four values (value1 through value4). Ideal for investor presentations, executive reports, and strategic marketing discussions where market positioning and competitive landscape need clear visual communication.
Usage Points
-
Main Usage
Visualize multi-dimensional market data, competitive positioning, revenue trends, and market share changes using area charts. Provides clear visual evidence for strategic decision-making in investor pitches, executive briefings, and market analysis presentations.
-
How to Use
Replace value1 through value4 with your actual data points for immediate use. Select the dark background version for professional, formal presentations and the light version for printed materials or bright-room settings. Use the standard area chart for trend comparison and the stacked area chart to show composition ratios relative to total values.
-
Recommended For
Essential for executives, finance teams, marketing departments, and business development professionals presenting market analysis findings. Perfect for investor pitches, quarterly business reviews, new market entry strategies, and competitive intelligence presentations requiring data-driven insights.
-
Slide Structure
Two-slide template. Each slide contains a title section with main heading and descriptive text, plus two chart areas. The left chart displays a standard area graph showing four-layer data trends, while the right chart presents a stacked area visualization illustrating each layer's proportional contribution to the total across the timeline.
Related Products
-

Purple Blue Area Chart – Dynamic Data Visualization for Market and Competitive Analysis
#Market and Competitor Analysis #Graph #Other
-

Comparison Bar Chart for Market Competition Analysis – Competitive Advantage
#Market and Competitor Analysis #Graph #Other
-

Competitive Comparison Area Diagram – Visualizing Market Advantage
#Market and Competitor Analysis #Graph #Other
-

Analysis of Key Competitor Positioning to Enhance Market Competitiveness
#Market and Competitor Analysis #Marketing Plan and Strategy #Diagram
