Diagram of Space Industry Development Areas
RJ0700015_12
- Last Update 07/26/2025
- File Size 3.1MB
- # of Slides 2
- File Format PPTX
- Slide Ratio 16:9
- Color
Keywords
- #Content-Based Slides
- #Design-Based Slides
- #Product/Service Introduction
- #Business Introduction
- #Graph
- #Composition
- #Business Areas
- #Other
- #Radar Chart Spider Chart
- #16:9
- #radial diagram PowerPoint slide
- #space industry development presentation
- #6-node diagram template
- #business sector classification PPT
- #how to create radial diagram in PowerPoint
About the Product
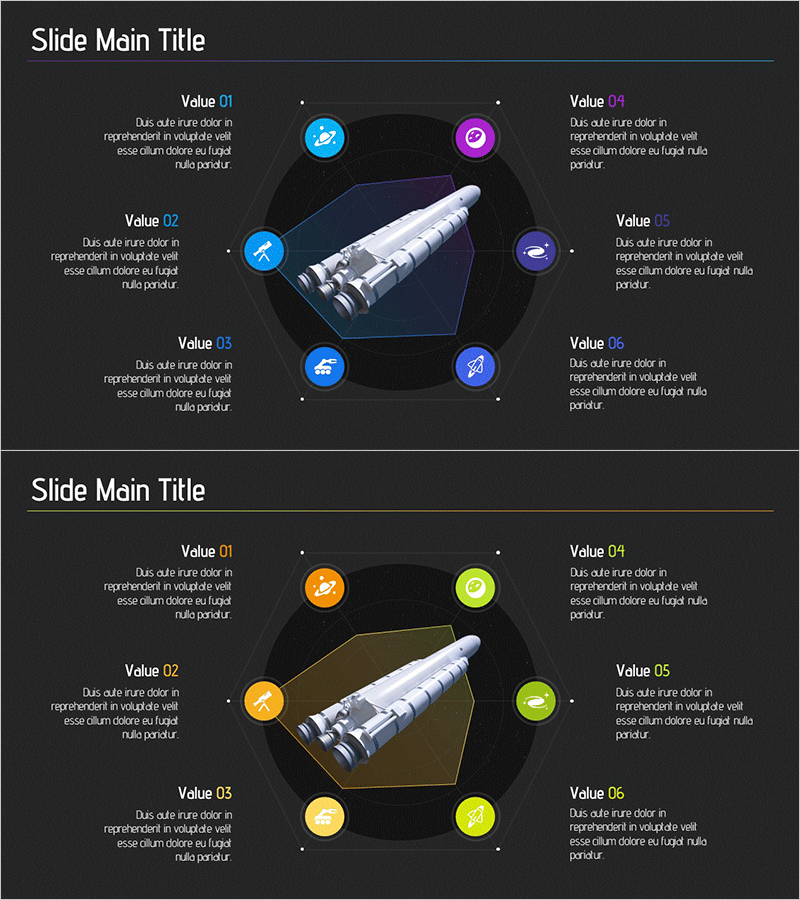
A radial diagram PowerPoint slide that expands from the center to six surrounding nodes, ideal for presenting space industry development areas. The dark background features circular icons in blue, purple, and orange tones, each representing a distinct industry sector. Two slide layouts are included: the first uses a blue color palette while the second employs warm orange tones, allowing flexibility for different presentation contexts. The 16:9 widescreen PPTX format enables quick customization to match your business domains, sectors, or organizational structure.
Usage Points
-
Main Usage
Visualize business domains, product categories, or organizational divisions using a radial structure that radiates from a central concept. Ideal for aerospace, advanced technology, and emerging business sectors where you need to emphasize both independence and interconnection of multiple areas.
-
How to Use
Place your core business concept or logo at the center, then populate the six surrounding nodes with your specific sectors or divisions. Replace the rocket imagery with your company symbol, update node text and icons to match your industry, and adjust colors to align with your brand identity.
-
Recommended For
Perfect for aerospace, advanced technology, renewable energy, and manufacturing companies presenting multi-sector business portfolios. Suitable for business plans, company profiles, investor pitch decks, and strategic presentations where equal emphasis on multiple business areas is required.
-
Slide Structure
Central 3D rocket image surrounded by six circular nodes arranged in cardinal and diagonal directions. Each node contains an icon and text area for customization. Connecting lines link each node to the center, establishing clear hierarchical relationships while maintaining visual balance.
Related Products
-

Modern Blue Template Diagram – Business Introduction
#Product/Service Introduction #Business Introduction #Diagram
-

Space Industry Sector Diagram – Visualization of Business Sectors
#Product/Service Introduction #Business Introduction #Diagram
-

Eco-friendly Furniture Product Overview – Diagram Emphasizing Sustainability
#Product/Service Introduction #Business Introduction #Diagram
-

Radar Chart for Supplements Presentation
#Product/Service Introduction #Graph #Features
