Schedule Planning Step 3 – Accelerating Business Strategy
RL0100055_4
- Last Update 12/21/2024
- File Size 2MB
- # of Slides 2
- File Format PPTX
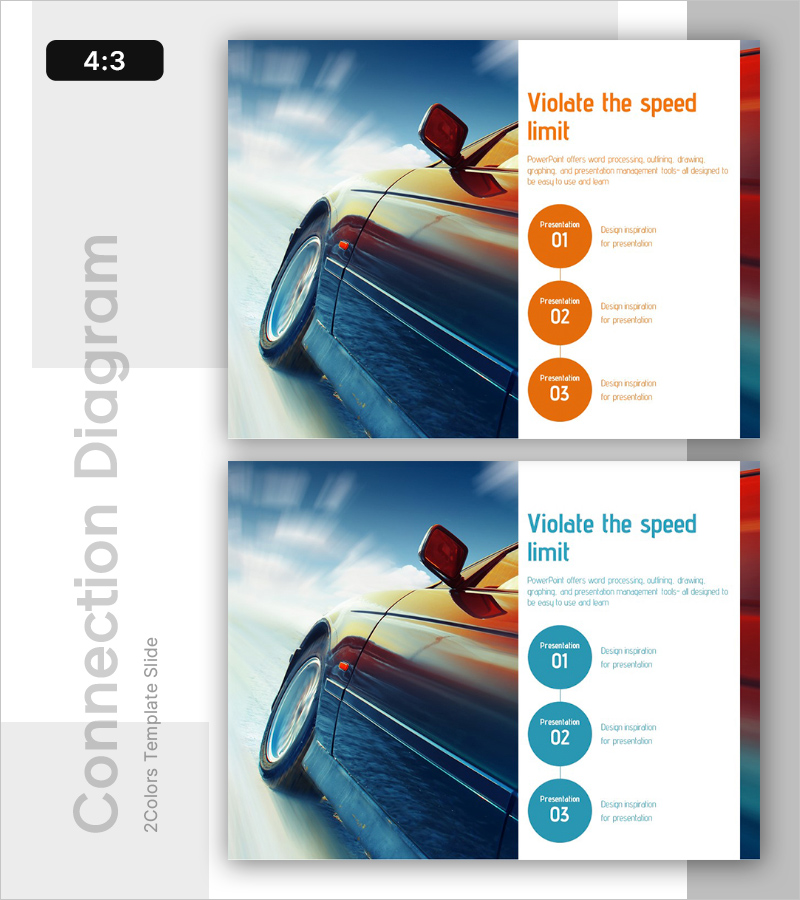
- Slide Ratio 4:3
- Color
Keywords
About the Product
A 3-step timeline PowerPoint slide that visualizes the execution schedule of business strategy initiatives. The layout combines a full-color image on the left with a numbered circular structure on the right, clearly communicating each phase's objectives and descriptions. The orange and blue dual-tone color scheme intuitively represents progress across phases, making it immediately applicable for presentations and business planning documents emphasizing strategic execution. Formatted in 4:3 aspect ratio PPTX with 2 slides, it adapts seamlessly to various presentation environments.
Usage Points
-
Main Usage
This slide clearly communicates the phased schedule and objectives of business strategy execution through visual representation. The numbered circular structure emphasizes the sequential progression of three phases, with dedicated description areas for each phase to accommodate specific implementation details. It effectively supports executive briefings, business plan presentations, and strategic meetings for communicating execution roadmaps.
-
How to Use
Insert a photo or graphic representing the business execution process in the left image area, then populate the right circular numbered section with each phase's objectives, timeline, and responsible departments. The orange circle highlights phase 1, while blue circles represent phases 2 and 3 for visual emphasis. Text input areas allow concise documentation of each phase's key content.
-
Recommended For
Recommended for executives, project managers, marketing planners, and business development teams responsible for strategy formulation and execution planning. Use it for quarterly business objective presentations, new project kickoff meetings, strategic execution plan reports, and investor-facing business plan presentations to clearly communicate phased timelines.
-
Slide Structure
2-slide composition with the first slide featuring three orange numbered circles and the second featuring three blue numbered circles. Each slide is divided 50-50 between a left full-color image area and a right text/circular diagram area, with dedicated title and description text spaces for each circle.
Related Products
-

Argument Induction Connection Diagram – Ideal for Product/Service Introduction
#Emotional Messages
-

Economic Consumption Template Intro
#Emotional Messages
-

Nested Round Diagram – Business Vision and Strategy
#Emotional Messages
-

Victory Factor Analysis Graph – Strengthening Market Competitiveness
#Emotional Messages
