Victory Factor Analysis Graph – Strengthening Market Competitiveness
RL0100038_4
- Last Update 01/20/2025
- File Size 0.7MB
- # of Slides 2
- File Format PPTX
- Slide Ratio 4:3
- Color
Keywords
About the Product
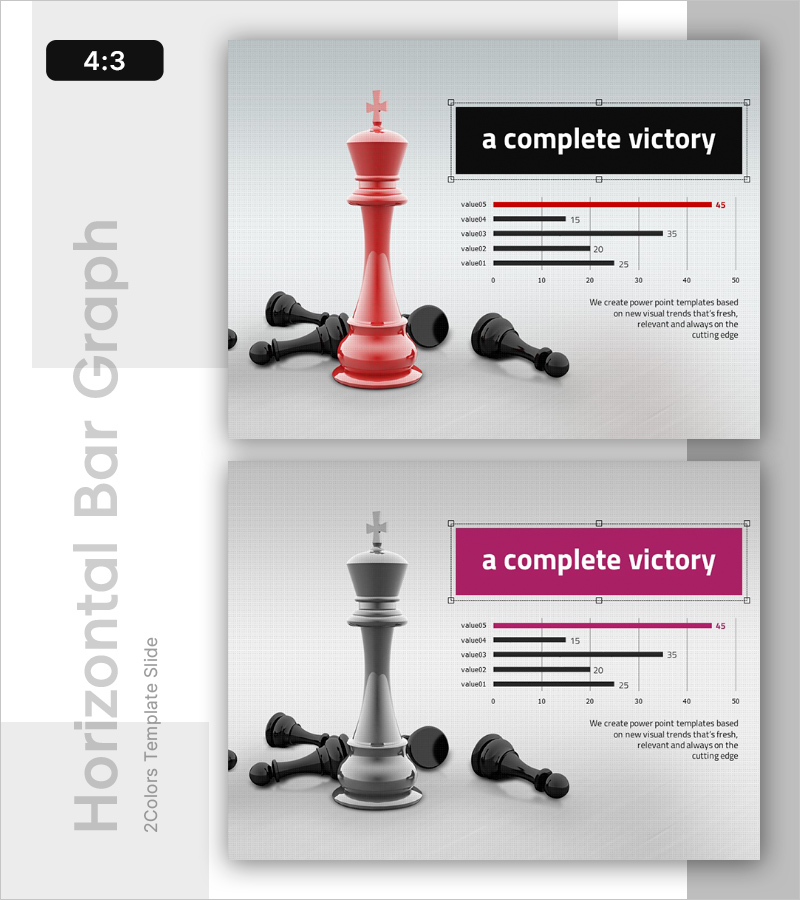
A horizontal bar graph PowerPoint slide designed for competitive advantage analysis and performance visualization. This presentation slide features a red and gray dual-tone color scheme that effectively compares five key performance indicators and competitive benchmarks at a glance. The layout includes a prominent title area and descriptive text space, making it ready to use for market competitiveness strategy presentations, performance analysis reports, and business success factor discussions. Available in 4:3 aspect ratio PPTX format for seamless compatibility with existing presentations.
Usage Points
-
Main Usage
This slide presents business success factors and competitive advantages through data-driven analysis and persuasive visualization. The horizontal bar graph enables simultaneous comparison of multiple metrics, clearly communicating market strengths and weaknesses. It is particularly effective for investor pitches, executive briefings, and partner presentations where performance evidence must be substantiated.
-
How to Use
Enter your analysis topic in the title text box (e.g., market share, customer satisfaction, product competitiveness), then update each bar label and corresponding values to match your data. Add key insights from your analysis in the description area to enhance audience comprehension. Colors can be retained or adjusted to align with your corporate brand guidelines.
-
Recommended For
Ideal for executive reports, business performance presentations, investor pitch decks (IR), strategic planning meetings, and marketing performance analysis presentations. Particularly suited for B2B presentations, shareholder meetings, board reports, and decision-making scenarios requiring quantitative data support.
-
Slide Structure
Structured with a black title box at the top (1 text field), a central horizontal bar graph comparing 5 items, and a descriptive text area on the right (1 field). One red accent bar highlights the primary metric while four gray bars represent competitive benchmarks, with numerical labels displayed at the end of each bar for optimal readability.


